| | Existing Pay for Performance and Strong Pay Governance Practices | • | Strong Pay-for-Performance Practices: | | | • | The overwhelming majority, 86%, of our CEO’s target total direct compensation, is variable, and is subject to financial performance metrics. In addition, 69%71% of target total direct compensation for the other executive officers, is variable, and is subject to financial performance metrics;metrics. | | • | More than two-thirds of the total compensation paid to our CEO, and half of the total compensation paid to the NEOs, is equity-based and aligned with shareholder interests. | | | • | 100% of the 2014 long-term incentive mix is equity-based; | | | • | An independent compensation consultant who reports directly to100% of the committeeannual incentive and performs no other services for the company;long-term incentive program is based on financial objectives; and | | | • | A direct line of communication between our stockholders and the board of directors;The long-term incentive program includes a three-year cumulative TSR modifier. | | • | Strong Pay Governance Practices: | | | • | No employment agreements with our executive officers; | | • | No tax gross-ups on Change-of-Control payments; | | | • | No special arrangements whereby extra years of prior service are credited under our pension plans; | | | • | No perquisites other than limited financial counseling and an executive physical benefit; | | | • | “Double-trigger” vesting provisions in our Change-of-Control arrangements; | | | • | A “clawback” policy that permits the company to recover bonuses from senior executives whose fraud or misconduct resulted in a significant restatement of financial results; | | | • | Prohibitions against pledging and hedging of our stock; | | • | Executive stock ownership policy that aligns executives’ and directors’ interests with those of stockholders, recently expanded to: (i) include more senior executives, and (ii) count only vested shares toward stock holding requirement. | | • | Other Strong Pay Practices: | | • | Separate roles of CEO and chairman of the board of directors; | | | • | An annual risk assessment of our pay practices; | | | • | Significant stock ownership guidelines that align executives’ and directors’ interests with those of stockholders; and | | • | An annual stockholder advisory vote on executive compensation. |
PROPOSAL 3: ADVISORY VOTE TO APPROVE EXECUTIVE COMPENSATION
The committee has also acted to make changes in 2013 in accordance with good pay governance, changing market practices and stockholder feedback by eliminating tax gross-ups, reducing severance benefits, providing onlyde minimisfringe benefits and reducing duplicative financial metrics between the annual and long-term incentive plans.
Finally, the committee and the company have made continual efforts to contact stockholders with respect to their thoughts on our compensation structure. Over the past years, the committee has adopted changes in executive compensation that directly relate to comments received from the stockholders.
Key Changes Made to our Executive Compensation Program in 2013
| • | Increased the weighting of financial objectives to 100% for the annual incentive program; | compensation; | | | • | Utilizing as partA direct line of communication between our stockholders and the LTI program a three-year cumulative TSR metric; | board of directors; | | | • | Reduced duplicative metrics across award types by replacingUse of two independent third-party compensation surveys (Radford Survey High-Tech Industry and Towers Watson Regressed Compensation Report) in determining the Adjusted earnings per share financial objective withcompetitiveness of executive compensation; | | • | Use of an Adjusted earnings before interestindependent compensation consultant that advises the Committee directly on the company’s compensation structure and taxes objective in annual incentive; | actions and performs no other services for the company; and | | | • | Enhanced disclosure of performance targets in the 2013 and 2014 proxy; | | | • | Revised our peer group in light of the evolving strategic direction of the company with increasing emphasis in the software and technology arena and to reflect the divestiture of PBMS; | | | • | Restructured the LTI design to be implemented in 2014 awards, making all long-term awards stock based; | | | • | Expanded the executive stock ownership policy to: (i) include more senior executives, and (ii) restrict the shares that will count toward stock holding requirement; | | | • | Introduced the Radford Survey High-Tech Industry in addition to the Towers Watson Regressed Compensation Report in determining the competitiveness of executive compensation; and | | | • | Reduced severance benefits payable on account of a Change of Control from three to two times participant’s annual salary and average annual incentive award and eliminated the excise tax gross-up. | targets. |
We have for the past several years regularly contacted many of our stockholders to give them an opportunity to share their views about our executive compensation program. In additionthe 2014 we reached out to holders of approximately 43% of our outstanding shares to answer questions concerning the changes summarized above, we are maintaining2014 proxy statement, including the existingexecutive compensation practicesprogram. Over the past few years, the Committee has implemented features in the executive compensation program that represent strong corporate governance policies.directly related to comments received from the stockholders. We urge stockholders to read the CD&A beginning on page 3532 of this proxy statement, which describes in more detail how our executive compensation policies and procedures operate and are designed to achieve our compensation objectives, as well as the “Summary Compensation Table” and other related compensation tables and narratives on pages 57 through 73,71, which provide detailed information on the compensation of our NEOs. We also invite stockholders to read our Annual Report on Form 10-K for the year ended December 31, 2013,2014, as filed with the Securities and Exchange Commission on February 21, 2014,20, 2015, which describes our business and 20132014 financial results in more detail. In accordance with Section 14A of the Exchange Act, and as a matter of good corporate governance, we are asking stockholders to indicate their support for our NEO compensation by voting FOR this advisory resolution at the 20142015 Annual Meeting: RESOLVED, that the stockholders of Pitney Bowes Inc. approve on an advisory basis the compensation of the company’s named executive officers disclosed in the Compensation Discussion and Analysis, the Summary Compensation Table and the related compensation tables, notes and narratives in this proxy statement for the company’s 20142015 Annual Meeting of Stockholders. This advisory resolution, commonly referred to as a “Say-On-Pay” resolution, is non-binding on the board of directors. Although non-binding, our board of directors and the committeeCommittee will carefully review and consider the voting results when making future decisions regarding our executive compensation program. The next “Say-on-Pay” advisory vote will occur at the 20152016 annual meeting.
PROPOSAL 3: ADVISORY VOTE TO APPROVE EXECUTIVE COMPENSATION Vote Required; Recommendation of the Board of Directors The vote on executive compensation is an advisory vote. The affirmative vote of the majority of the votes cast will constitute the stockholders’ non-binding approval with respect to our executive compensation programs. Abstentions and broker non-votes will not be votes cast and therefore will have no effect on the outcome of the vote. The board of directors recommends that stockholders vote FOR the approval of the advisory resolution on executive compensation. Proposal 4: Approval of the Pitney Bowes Inc. Directors’ Stock Plan
Proposal 4: Approval of the Pitney Bowes Inc.
Directors’ Stock Plan, as Amended and Restated
The board of directors recommends that stockholders approve the Pitney Bowes Inc. Directors’ Stock Plan, as amended and restated (Plan). The board of directors unanimously approved the Plan in February 2014. The Plan will become effective May 12, 2014, upon stockholder approval at our annual meeting. The Plan governs grants of stock-based awards to non-employee directors, which is an important component of our non-
employee director compensation program, enabling us to attract and retain persons of outstanding competence to serve as non-employee directors and encouraging the alignment of non-employee director compensation with stockholder interests.
The complete text of the Plan approved by the board of directors is attached as Annex A to this Proxy Statement. The following discussion is qualified in all respects by reference to Annex A.
Why We Believe You Should Approve the Plan
Equity compensation is an essential part of our non-employee director compensation program and enables us to attract and retain persons of outstanding ability. We believe our future success depends on our ability to attract, motivate and retain high quality non-employee directors and approval of the Plan is critical to achieving this success. The potential change in value of the equity compensation to the board members over time directly aligns their interests with the long-term interests of our stockholders.
We believe that we have demonstrated our commitment to sound equity compensation practices. We recognize that equity compensation awards dilute stockholder equity and, therefore, we have carefully managed our equity incentive compensation. In fact, the equity to be utilized under the new Directors’ Stock Plan will be drawn from the Pitney Bowes Stock Plan equity reserve which the stockholders previously approved in 2013. The board targeted its compensation, including the equity component, to be consistent with the market median, and we believe our historical share usage has been responsible and mindful of stockholder interests, as described further below.
Plan Highlights
The Plan provides for automatic annual grants of restricted stock units for non-employee directors.
Awards granted under the Plan will be settled by the issuance of shares of common stock, $1 par value per share, of the company (Common Stock), that are drawn from the shares of Common Stock available for issuance under the Pitney Bowes Inc. 2013 Stock Plan (2013 Stock Plan), previously approved by the company’s stockholders. As has historically been and continues to be the case, however, non-employee directors will not participate in the 2013 Stock Plan. Approval of the Plan will not result in an increase in the number of shares that are available for issuance under our equity compensation plans. As of December 31, 2013, 19,180,600 shares remain available for issuance under the 2013 Stock Plan. Based on our past experience, we believe the previously approved share pool under the 2013 Stock Plan will provide us an opportunity to grant equity awards under the 2013 Stock Plan and the Plan for approximately four more years before we would need to seek stockholder approval of more shares.
Provisions Designed to Protect Stockholder Interests
The Plan has several provisions designed to protect stockholder interests and promote effective corporate governance including:
| • | Limit on grants of awards (specific annual grant amounts are “hard-wired” into the Plan); | | | | | • | Prohibition on share recycling or “Liberal Share Counting” practices (pursuant to the share counting provisions of the 2013 Stock Plan); and | | | | | • | No “evergreen” provision to automatically increase the number of shares issuable under the Plan (shares issuable under the Plan are drawn from the 2013 Stock Plan share pool). |
PROPOSAL 4: APPROVAL OF THE PITNEY BOWES INC. DIRECTORS’ STOCK PLAN
Plan Terms and Conditions
Purpose of the Plan
The purpose of the Plan is to enable the company to attract and retain persons of outstanding competence to serve as non-employee directors of the company by paying such persons a portion of their compensation in stock of the company pursuant to the terms of the Plan.
Plan Administration
This Plan is to be administered by the Governance Committee of the board or any successor committee having responsibility for the remuneration of the directors (hereinafter in this Proposal referred to as the “Committee”).
Eligibility and Participation
Persons who serve as members of the board of directors of the company and who are not “employees” of the company or its subsidiaries are eligible to participate in the Plan. Currently, all of the company’s nine (9) non-employee directors are eligible to, and do participate in, the Plan.
Shares Available under the Plan
Awards granted under the Plan will be settled by the issuance of shares of Common Stock that are drawn from the shares of Common Stock available for issuance from time to time under the 2013 Stock Plan, previously approved by the company’s stockholders. Shares of Common Stock issued pursuant to awards of restricted stock units under the Plan shall reduce, on a one-for-one basis, both (a) the overall maximum number of shares of Common Stock available for issuance under the 2013 Stock Plan and (b) the sub-limit under the 2013 Stock Plan for the number of shares that may be issued for awards that are not options or stock appreciation rights.
As of December 31, 2013, 19,180,600 shares remain available for issuance under the 2013 Stock Plan share pool. In addition to the number of shares described in the preceding sentence, any shares associated with outstanding awards under the prior plans (as defined in the 2013 Stock Plan) as of April 30, 2013 that on or after
such date cease for any reason to be subject to such awards (other than by reason of exercise or settlement of the awards to the extent they are exercised for or settled in vested and nonforfeitable shares) will become available for issuance under the 2013 Stock Plan share pool. Shares delivered out of the 2013 Stock Plan share pool will be authorized but unissued shares of Common Stock, treasury shares or shares purchased in the open market or otherwise. To the extent that any award payable in shares is forfeited, cancelled, returned to the company for failure to satisfy vesting requirements or upon the occurrence of other forfeiture events, or otherwise terminates without payment being made, the shares covered thereby will no longer be charged against the maximum share limitation under the 2013 Stock Plan share pool and may again become available under the 2013 Stock Plan share pool.
Terms and Conditions of Restricted Stock Units Awards
Each non-employee director then serving as a director of the company will receive an annual award on the date of the first meeting of directors after each annual stockholders’ meeting of restricted stock units with respect to a number of shares of Common Stock having a fair market value equal to $100,000; provided, however, that a non-employee director who joins the board after such date will receive a pro-rated award of restricted stock units. Each restricted stock unit granted under the Plan will represent the right to receive one share of Common Stock on the date that is one year following the date the award is granted; provided, however, that with respect to each annual grant the company may, in its sole discretion, provide non-employee directors with the one-time opportunity to elect to defer the settlement of the restricted stock units until the termination of the non-employee director’s service as a director of the company.
Unless the Committee determines otherwise, non-employee directors will have the right to receive dividend equivalents in connection with the restricted stock units
granted under the Plan pursuant to which the non-employee directors will be entitled to receive payments equivalent to dividends with respect to the number of shares subject to the corresponding award of restricted stock units, which payments, unless the Committee determines otherwise, shall be paid to the non-employee directors in cash as and when such dividends are paid to the holders of Common Stock.
Unless the Committee provides otherwise, non-employee directors have no voting or other rights (other than the dividend equivalent rights described above) as a stockholder with respect to the shares of Common Stock subject to and/or issuable pursuant to any awards of restricted stock units granted under the Plan until such shares are actually issued.
The restricted stock units granted under the Plan may not be sold, assigned, pledged or otherwise transferred by the non-employee director, other than by will or the laws of descent and distribution.
PROPOSAL 4: APPROVAL OF THE PITNEY BOWES INC. DIRECTORS’ STOCK PLAN
Adjustments for Corporate Changes
In the event of any change in the number or kind of outstanding shares of Common Stock of the company by reason of a recapitalization, merger, consolidation, dividend, combination of shares or any other change in the corporate structure or shares of stock of the company, the board will make equitable and appropriate adjust-
ments in the number of restricted stock units to be awarded to non-employee directors, in the number of shares subject to and any other affected provisions of outstanding awards of restricted stock units to prevent enlargement or diminution of the benefits intended to be granted under the Plan.
Amendment and Termination
The company reserves the right to amend, modify or terminate the Plan at any time by action of the board, provided that such action will not adversely affect any non-employee director’s rights under the provisions of the Plan with respect to awards that were made prior to such action.
Plan Benefits
As described above, each non-employee director then serving as a director of the company will receive an annual award on the date of the first meeting of directors after each annual stockholders’ meeting of restricted stock units with respect to a number of shares of Common Stock having a fair market value equal to $100,000; provided, however, that a non-employee director who
joins the board after such date will receive a pro-rated award of restricted stock units.
On February 28, 2014, the closing price of our common stock traded on the New York Stock Exchange was $25.45 per share.
U. S. Federal Income Tax Consequences
The following discussion summarizes the material U.S. federal income tax consequences to the company and the participating non-employee directors in connection with the Plan under existing applicable provisions of the IRC and the accompanying regulations. The discussion is general in nature and does not address issues relating to the income tax circumstances of any individual non-employee director. The discussion is based on federal income tax laws in effect on the date of this proxy statement and is, therefore, subject to possible future changes in the law. The discussion does not address the consequences of state, local or foreign tax laws.
Restricted Stock Units
Non-employee directors do not recognize income at the time of the grant of restricted stock units. When the award vests or is paid, non-employee directors generally recognize ordinary income in an amount equal to the fair market value of the restricted stock units at such time, and the company will receive a corresponding deduction.
Vote Required; Recommendation of the Board of Directors
Approval of the Pitney Bowes Inc. Directors’ Stock Plan as amended and restated, requires the affirmative vote of a majority of votes cast. Under our By-laws, abstentions and broker non-votes will not be votes cast and therefore will have no effect on the outcome of the vote. However, for purposes of approval under New York Stock Exchange rules, abstentions are treated as votes cast, and, therefore, will have the same effect as an “against” vote, and broker non-votes are not considered votes cast, and, therefore, will have no effect on the outcome of the vote.
The board of directors recommends that stockholders vote FOR the proposal to approve the Pitney Bowes Inc. Directors’ Stock Plan.
Equity Compensation Plan Information The following table provides information as of December 31, 20132014 regarding the number of shares of common stock that may be issued under our equity compensation plans. | | | | | | | (c) | | | | | | | | | Number of securities | | | | | (a) | | | | remaining available for | | | | | Number of securities to be | | (b) | | future issuance under equity | | | | | issued upon exercise of | | Weighted-average exercise | | compensation plans | | | | | outstanding options, | | price of outstanding options, | | excluding securities | | | Plan Category | | warrants and rights | | warrants and rights | | reflected in column (a) | | (a)
Number of securities to be
issued upon exercise of
outstanding options,
warrants and rights | | (b)
Weighted-average exercise
price of outstanding options,
warrants and rights | | (c)
Number of securities
remaining available for
future issuance under equity
compensation plans
excluding securities
reflected in column (a) | | Equity compensation plans approved by security holders | | 14,526,633 | | | $31.78 | | | 19,180,600 | | | | 13,323,075 | | | | $31.14 | | | | 19,715,336 | | | Equity compensation plans not approved by security holders | | — | | | — | | | — | | | | — | | | | — | | | | — | | | Total | | 14,526,633 | | | $31.78 | | | 19,180,600 | | | | 13,323,075 | | | | $31.14 | | | | 19,715,336 | (1) |
| (1) | These shares are available for stock awards made under both the Stock Plan of 2013 and the Directors’ Stock Plan. As of December 31, 2014, of the total 19,715,336 shares remaining and available for future issuance 10,527,654 are available for full value share awards. |
Report of the Executive Compensation Committee The Executive Compensation Committee (Committee) of the board of directors (1) has reviewed and discussed with management the section included below in this proxy statement entitled “Compensation Discussion and Analysis” (CD&A) and (2) based on that review and discussion, the Committee has recommended to the board of directors that the CD&A be included in the company’s Annual Report on Form 10-K for the year ended December 31, 20132014 and this proxy statement. By the Executive Compensation Committee of the board of directors, Eduardo R. Menascé, Chairman
Anne M. Busquet
Anne Sutherland Fuchs
David B. Snow, Jr. Compensation Discussion and Analysis The following discussion and analysis contains statements regarding company performance targets and goals. These targets and goals are disclosed in the limited context of our compensation programs and should not be understood to be statements of management’s expectations or estimates of results or other guidance. Investors should not apply these statements to other contexts. Executive Summary Overview This Compensation Discussion and Analysis, or CD&A section explains our compensation philosophy, summarizes the material components of our compensation programs and reviews compensation decisions made by the Executive Compensation Committee (the Committee) and the independent board members. The Committee, comprised of only independent directors, makes all compensation decisions regarding the seven executives identified as Named Executive Officers (NEOs) in the Summary Compensation Table below.below, other than the Chief Executive Officer (CEO). The independent board members, based on recommendations by the Committee, decidedetermine compensation actions impacting the Chief Executive Officer (CEO).CEO. In 2013, the company’s NEOs included two former executive officers (Leslie Abi-Karam and Vicki A. O’Meara) who would have been in the top five highly paid officers had they still been employed by the company at the end of the year (see page 68 for additional details). As a result, there are seven NEOs for 2013:
2014 Named Executive Officers 2013 Named Executive Officers | | | • | Marc B. Lautenbach, President and Chief Executive Officer | | | • | Michael Monahan, Executive Vice President and Chief Financial Officer (effective February 9, 2015, Mr. Monahan was also appointed to the newly created role of Chief Operating Officer) | | • | Mark L. Shearer, Executive Vice President and President, Pitney Bowes SMB Mailing Solutions | | | • | Abby F. Kohnstamm, Executive Vice President and Chief Marketing Officer | | | • | Mark F. Wright, Executive Vice President and President, PB Digital Commerce Solutions1 | | • | Daniel J. Goldstein, Executive Vice President and Chief Legal & Compliance Officer | | • | Leslie Abi-Karam, former Executive Vice President and President, Pitney Bowes Communications Solutions | | • | Vicki A. O’Meara, former Executive Vice President and President, Pitney Bowes Services Solutions |
EffectiveSince December 3, 2012, Pitney Bowes has bifurcated the boardrole of directors elected Marc B. Lautenbach President and CEO and appointedchairman of the board of directors. Marc B. Lautenbach is President and CEO and Michael I. Roth is non-executive chairman of the board of directors.
In his first year as our new President and CEO, Mr. Lautenbach focused on resetting the strategic direction of the company and beginning to execute on that strategy, assembling the right team to lead the company’s critical areas of development over the next several years and beginning to execute on initiatives consistent with the new strategies outlined below. Considering the future prospects of the company, Mr. Lautenbach invested $1,000,000 of his own financial resources in company stock. In addition, two newly hired executive business unit heads also purchased company stock from their own financial resources.
Summary of 20132014 Business Results2 In 2013, the company2014, Pitney Bowes achieved significant success in the early stages of executing onprogress against its strategythree strategic initiatives to transform the company forand unlock shareholder value by 1) stabilizing the future. This success was evidencedmail business, 2) driving operational excellence, and 3) growing its business through expansion in digital commerce. During the year, we continued our financial resultsimplementation of a new go-to-market strategy, divested certain business operations, and attainment of certain objectives targeted at longer-term achievement, including solidifying our balance sheet and divesting businesses no longer in line withinitiated a global effort to streamline the company’s long-term strategy. Our total shareholder return (TSR) forback-office systems. All aspects of our Digital Commerce Solutions segment grew revenue in 2014, including the year was an extraordinary 132%, which placed us fifth in year-over-year TSR among all S&P 500 companies for 2013. We believeintroduction of outbound services from the stock price increase reflected stockholder recognition that our first steps in executing on our new strategy to unlock the value embedded in our company were successful and position us well for the future.United Kingdom. We identified three major objectives for the company that would determine our progress towards transforming our businessesIn addition, we continued to deliver innovative physical and digital products and solutions and made significant progress on each. These objectives wereinvestments in marketing in support of the transformation of our brand. One of the main goals of the re-branding effort is to update the market’s perception of the company. This is the first brand refresh since 1971 and only the third in our 95 year history. The new brand strategy clarifies the company’s role in the changing world of commerce, emphasizing the interplay between physical and digital communications by spotlighting both our traditional strengths in mailing solutions for the small, medium and large enterprises, as follows: (1) stabilize the mailing business; (2) achieve operational excellence;well as our emerging strength in newer technology areas such as location intelligence, customer information management and (3) investcross-border commerce. The new branding launched in growth initiatives.early January 2015.
From a financial perspective: | | • | StabilizeWe returned $152 million to shareholders in dividend payments on Pitney Bowes Common Stock and repurchased $50 million of its own shares. | | | | | • | Total Shareholder Return (TSR) for 2014 was 7.63%, and its two-year TSR calculated as a Compound Annual Growth Rate (CAGR) was 58.23%, placing us at the Mailing Business.The recurring revenue streams in 2013 forvery top of our global Mailing business continued to decline at a slower ratepeer group. When compared to prior years contributing to the overall stabilization of the Mailing business. Equipment salesS&P 500 companies this two-year performance places us in the Production Mail and Small and Medium Business Solutions (SMB) segments improved. Our new go-to-market strategy implementation in the SMB business is improving our sales process and enhancing our client experience, while reducing costs. |
1 | Title effective as of February 2014.96th percentile. | 2 | | | | • | We had our first full year of reported revenue growth since 2008, with an increase of 1% on both a constant currency and reported basis. | | | | | • | The financial results discussed2014 diluted earnings per share from continuing operations were $1.90, compared to $1.81 in this summary are on a GAAP2013. | | | | | • | Earnings before interest and non-GAAP basis. See detailed discussion under the table on page 55 “Accounting Items and Reconciliation of GAAPtaxes were $731 million in 2014 compared to non-GAAP Measures.”$688 million in 2013. |
COMPENSATION DISCUSSION AND ANALYSIS | | • | Achieve Operational Excellence.Our effortsFree cash flow was $571 million in reducing expenses in 2013 resulted in a $71 million savings in selling, general and administrative expenses2014 compared to the prior year. We are$635 million in 2013. This nevertheless was a strong result when factoring in the early stages of implementing a new enterprise resource planning (ERP) system to streamline and consolidate many of our back-office operations. We signed a contract to sell our World Headquarters building in 2014. This is another example of our commitment to reducing operating expenses going forward. In addition, in 2013, we sold three businesses, Pitney Bowes Management Services (PBMS), International Mailing Services (IMS) andcapital expenditures invested into the Nordic furniture business. We sold these businesses because they did not fit within our future strategic intent for the company. We used the net proceeds from the North American portion of the PBMS sale to strengthen our balance sheet by redeeming $300 million in bonds originally scheduled to mature in 2014. Also in 2013, our clear focus on initiatives surrounding inventory and accounts receivables, two key components of working capital, generated over $100 million of cash improvements. | | | | | • | Invest in Growth Initiatives.In 2013, we continued to invest in our e-commerce business which grew revenue sequentially at a high double digit rate. In our software business, we brought in new leadership with skill sets to support our new go-to-market strategy, which we expect will bring revenue growth in the software business. We also moved to increase our investment to 100% effective 2014, in our high growth potential Brazilian joint venture by purchasing our joint venture partner’s interest in the business. |
Turning to our financial performance in 2013, revenue was $3.869 billion compared to $3.915 billion in 2012; however the 1% decrease was more favorable than the year-over-year trend from prior years. Also, we grew revenue in the fourth quarter of 2013, with total revenue of $1 billion representing an increase of 2% over the prior year’s fourth quarter. Adjusted earnings per diluted share from continuing operations for 2013 were $1.88, compared to $1.96 in 2012. Adjusted earnings before interest and taxes were $711 million compared to $744 million in 2012. Adjusted free cash flow for the year was $635 million, and we generated $625 million in cash from operations. Our digital commerce solutions segment experienced higher growth with revenue increasing 3% year over year, including a 17% growth rate in the fourth quarter. Our digital commerce solutions revenue for the year increased from $578 million to $596 million. Our production mail business had an outstanding year due to the growth in its revenue and gross margin. In 2013, we reduced debt on the balance sheet by $671 million compared to year-end 2013. In aggregate, the 2013 financial results were within the guidance the company provided to the investment community.
In addition, in 2013:
| • | We accelerated globalization of key shared service functions including Information Technology, supply chain, service, and client care which will standardize and consolidate key business processes. | | | | | • | We created a single global marketing organization, which will enable us to better serve our clients, leverage our size, and create the foundation to enable us to integrate our organization. | | | | | • | We reorganized our business into three segments: (i) a Digital Commerce solution; (ii) SMB Solution Group; and (iii) an Enterprise Business Solutions Group, which will better align our businesses for which we have a similar strategic intent and will enable us to better serve our clients. | | | | | • | We took important steps to improve our go-to-market capabilities by deepening our specialization in our software business and creating a more robust go-to-market capability in our SMB business. | | | | | | | • | We announced a multi-year licensing agreementreduced debt by $100 million and took additional actions with Twitter, the leading global real-time information network,our debt portfolio to provide location intelligence solutions for its mobile platform. | | | | | • | We announced an interactive digital communications exchange with Broadridge Financial Solutions, Inc. utilizing technology developed by VollyTMthat will make it easier for businesses to communicate with consumers about their most important transactions. This new platform, powered by Amazon Web Services (AWS), enables consumers to securely receive and store comments and manage payments on any participating online channel they choose.create further financial flexibility. | | | | | | | • | We solidified our financial flexibilityreduced sales, general and administrative expenses by strengthening our balance sheet, reducing our dividend payments and implementing key initiatives to reduce our cost structure, working capital and improve our overall efficiency. | | | | | • | We enhanced the company’s existing strong business talent with outside recruits of seasoned executives with critical skills and pertinent experience necessary to lead our company’s transformative development over the next several years.$42 million. |
In summary, in 2013, we saw improvingshort, 2014 was a year of significant progress for Pitney Bowes. We continue to see positive trends in our businessbusinesses and made significantare making material progress totoward unlocking the long-term value embedded in our company. Going forward we remain confident about our multi-year journey to transform the company and deliver sustained value for the benefit of our clients, our shareholders and our employees. Some of the amounts in the CD&A portion of this proxy statement are shown on a non-GAAP basis. For additional detail on the calculation of the financialsfinancial results reported, please refer to the table on page 55 “Accounting Items and Reconciliation of GAAP to Non-GAAP Measures”.“Non-GAAP measures.” We urge stockholders to read our Annual Report on Form 10-K for the year ended December 31, 2013,2014, filed with the SEC on February 21, 2014,20, 2015, which describes our business and 20132014 financial results in more detail. CEO 2014 Compensation The compensation package of our President and CEO reflects Pitney Bowes’ enhanced performance-linked pay philosophy and is competitive when compared to our peer group and two third-party compensation survey reports (see description on competitive benchmarking of compensation on pages 50 to 51). The following are characteristics of Mr. Lautenbach’s compensation compared against our peer group, the Towers Watson Regressed Compensation Report and the Radford High Tech Industry Survey (Survey Reports); | | Percentage of median | Percentage of median | | | Peer Group CEOs | Survey Reports CEOs | | Base Compensation* | 91% | 88% | | Total Cash Compensation* | 93% | 90% | | Total Direct Compensation* | 96% | 98% |
| * | See page 40 for definitions of compensation terms. |
COMPENSATION DISCUSSION AND ANALYSIS CEO 2013 Compensation
The compensation package of our President and CEO reflects the enhanced performance-linked pay philosophy the board adopted in 2012 and further enhanced in 2013 and is competitive when compared to our peer group and two third-party compensation survey reports. Mr. Lautenbach’s total direct compensation is 91% of the market median of total direct compensation for CEOs in our peer group and 94% of the average of the median CEO total direct compensation using the Towers Watson Regressed Compensation Report and Radford High Tech Industry Survey (Survey Reports). Mr. Lautenbach’s base compensation is 87% of the market median of the peer group and 85% of the average of the median of the Survey Reports. His total cash compensation is 86% of the market median of the peer group and 88% of the average of the median of the Survey Reports.
In the above illustration, because the peer median and Survey Reportsthe average median data of the Survey Reports is reported at target, Mr. Lautenbach’s compensation elements are also illustrated at target for comparison purposes. Mr. Lautenbach’s long-term incentive amount includes the value of his one-time sign-on grant of premium-priced stock options, which are amortized over the vesting period of the options. Pitney Bowes CEO 
The following highlights 20132014 compensation actions for the President and CEO approved by the board of directors: | | • | Base salary remained atincreased to $900,000 (from $850,000 in 2013 (the board of directors and the Committee approved a freeze of base salaries for the CEO and NEOs in 2013) to bring Mr. Lautenbach closer to market median(1); | | | | | | | • | Annual incentive target remained atincreased to 135% (from 130% in 2013), moving Mr. Lautenbach’s total target cash compensation closer to market median(1), resulting in a payout of $1,209,975$1,519,965 (after applying the Committee-approved 2013 Annual Incentive2014 annual incentive multiplier (see pages 44 and43 to 45 for details)); | | | | | | | • | Long-term incentive target remained atincreased to $4,500,000 (from $4,000,000 in 2013) moving Mr. Lautenbach’s total target direct compensation closer to market median(1), with the February 20132014 grant consisting of 60% Cash Incentive70% Performance Stock Units (CIUs)(PSUs) and 40%30% Restricted Stock Units (RSUs). |
| (1) | Market median is calculated based upon a comparison to the Towers Watson Regressed Compensation Report, the Radford High Tech Industry Survey and the company’s peer group. |
COMPENSATION DISCUSSION AND ANALYSIS Snapshot of 2014 Pay for Performance Actions In making its 2014 compensation decisions and recommendations, the Committee considered the following, among other things: | • | our financial results; | | • | the achievement of the compensation objectives (see discussion beginning on page 43); | | • | our relative and absolute Total Shareholder Return (TSR); and | | | • | stockholder feedback. |
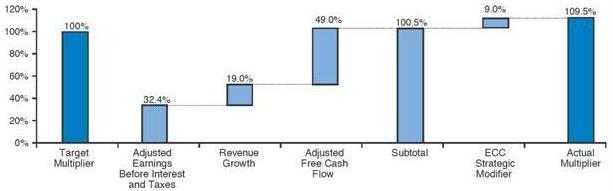
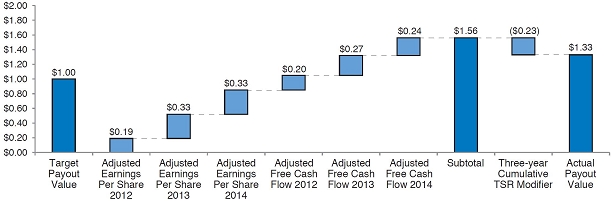
Our 2014 TSR was a solid 7.63%, which followed a 2013 TSR of 132%, resulting in a compound annual growth rate (CAGR) of 58.23% over two calendar years. Pitney Bowes’ two-year CAGR placed it first among its peer group. This illustrates the significant improvement occurring in our businesses over the last two years. Including 2012, the year preceding both Mr. Lautenbach’s tenure as CEO and the initiation of the current three-year strategic plan, our three-year cumulative TSR is 16.99% and places us at the 33rd percentile of our peer group. Based on 2014 financial results, the Committee and independent board members approved an annual incentive payout of 125.1% of target, after application of the Strategic Modifier. For the 2012 – 2014 Cash Incentive Units (CIUs), part of the company’s long-term incentive award, the Committee approved a CIU payout of $1.33 per unit, after application of the TSR Modifier. The following tables compare the actual payouts in 2014 and 2013: | | | 2014 Actual Payout | | 2013 Actual Payout | | Percentage change | | Annual Incentive | | Factor as a % of Target | | Factor as a % of Target | | 2014 vs. 2013 | | Financial Objectives | | | 115.7 | % | | | 100.5 | % | | | | | | Strategic Modifier(1) | | | 9.4 | % | | | 9.0 | % | | | | | | Subtotal | | | 125.1 | % | | | 109.5 | % | | | | | | Total Payout Factor | | | 125.1 | % | | | 109.5 | % | | | 14.2 | % |
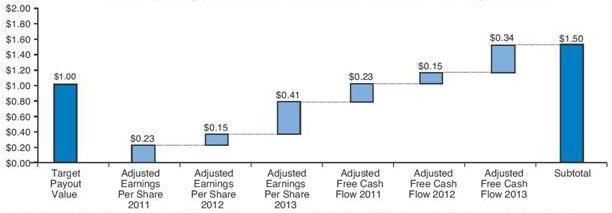
| | | 2014 Actual Unit Payout | | 2013 Actual Unit Payout | | Percentage change | | Long-Term Incentive | | Value (2012 – 2014 cycle) | | Value (2011 – 2013 cycle) | | 2014 vs. 2013 | | Adjusted Earnings per Share | | | $0.85 | | | | $0.83 | | | | | | | Adjusted Free Cash Flow | | | $0.71 | | | | $0.77 | | | | | | | TSR Modifier(2) | | | ($0.23 | ) | | | ($0.10 | ) | | | | | | Subtotal | | | $1.33 | | | | $1.50 | | | | | | | Total Payout Value | | | $1.33 | | | | $1.50 | | | | (11.3 | %) |
| •(1) | The secondstrategic modifier in 2014 included employee engagement, sustainable engagement, client focus and final tranche of a one-time sign-on grant of 400,000 premium-priced stock options was granted in February 2013 with an exercise price equal to 160% of the closing price of company stock on February 11, 2013.team metrics measured from employee survey results. See page 44 for additional details. | | | | |
| | º(2) | The option awards will vest in four equalTSR Modifier for the 2012 – 2014 cycle is a cumulative three-year modifier. The 2011 – 2013 CIU cycle is an annual installments beginningmodifier aggregated each year over the three year cycle. The TSR Modifier modifies the final payout by up to +/– 25% based on December 3, 2013 and ending on December 3, 2016, the fourth anniversarycompany’s TSR as compared to a comparator group. In the 2012-2014 cycle, the comparator group consisted of the grant.company’s peer group. In the 2011-2013 cycle, the comparator group was the S&P 500. The relative TSR modifier for the 2011 – 2013 cycle and 2012 – 2014 cycle was –6% and –15%, respectively. |
For additional detail on the calculation of the financial metrics described above please refer to page 55 “Non-GAAP Measures” and corresponding table. Also see “2014 Compensation” beginning on page 42 of this proxy statement for a discussion of each of the compensation components and the respective payouts. COMPENSATION DISCUSSION AND ANALYSIS Funding of the 2014 Annual Incentive Pool and Payout Multiplier 
The sum of the metrics may not exactly equal the total due to rounding. For additional detail on the calculation of the financial metrics shown in this chart please refer to the table on page 55 “Non-GAAP Measures.” Funding of the 2014 Cash Incentive Unit Pool and Payout Value 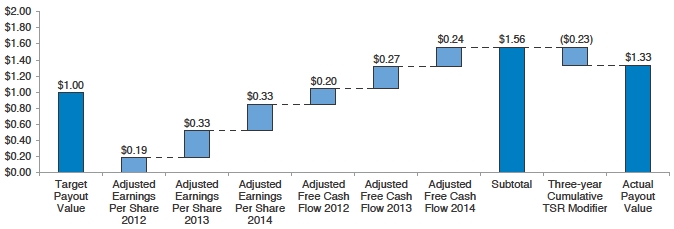
The amounts above include the impact of the Modifier for total shareholder return (TSR). The sum of the metrics may not exactly equal the total due to rounding. The amounts shown in the charts above are based on non-GAAP measures. For additional detail on the calculation of the financial metrics shown in this chart please refer to the table on page 55 “Non-GAAP Measures.” COMPENSATION DISCUSSION AND ANALYSIS Summary of 20132014 Executive Compensation Changes At the company’s annual meeting of stockholders in 2013,2014, stockholders overwhelmingly approved the company’svoted in favor of our executive compensation by a voteover 95% of approximately 93% of the votes cast in favor. During 2013, managementcast. Management and the Committee maintained theirmaintain a commitment to obtaining and considering stockholder feedback on the company’s compensation program by soliciting feedback over the course of the year. Most of the changes in 2013 were made as a result of stockholder outreach and the 2012 Say-On-Pay vote. The following highlights the changes that wewere made to the program in 2014 and in 2013. 
KEY COMPENSATION ACTIONS 2014 Implemented new LTI design mix for 2014 awards, making 100% of the long-term awards stock based, with an
allocation of 70% PSUs and 30% RSUs; Rolled out a new executive stock ownership policy to: (i) include
more senior executives, and (ii) restrict the shares that will count
toward stock holding requirement to only vested shares; and Instituted a deferral program to facilitate a quicker path to
executive stock ownership. 2013 Increased the weighting of financial objectives to 100% for the annual incentive program; Enhanced disclosure of performance targets; Revised our peer group in light of the company’s evolving strategic direction with increased
emphasis in software and technology; Reduced severance benefits payable on account of a Change-of-Control from three to two times
annual salary and average annual incentive; and Eliminated the excise tax gross-up. These highlights will be discussed in more detail in “2013the section titled “2014 Compensation” beginning on page 4342 of this proxy statement. | • | Increased the weighting of financial objectives to 100% for the annual incentive program; | | | | | • | Reduced duplicative metrics across award types by replacing the Adjusted earnings per share financial objective with an Adjusted earnings before interest and taxes objective in the annual incentive plan; | | | | | • | Enhanced disclosure of performance targets in the 2013 proxy statement; | | | | | • | Revised our peer group in light of the evolving strategic direction of the company with increasing emphasis in the software and technology arena and to reflect the divestiture of PBMS; | | | | | • | Restructured the LTI design to be implemented in 2014 awards, making all long-term awards stock based; | | | | | • | Expanded the executive stock ownership policy to: (i) include more senior executives, and (ii) restrict the shares that will count toward stock holding requirement; | | | | | • | Introduced the Radford High-Tech Industry Survey Report in addition to the Towers Watson Regressed Compensation Report in determining the competitiveness of executive compensation; and | | | | | • | Reduced severance benefits payable on account of a Change of Control from three to two times the participant’s annual salary and average annual incentive award and eliminated the excise tax gross-up. |
Snapshot of 2013 Compensation Payout Decisions
In making its compensation decisions and recommendation for the 2013 performance year, the Committee considered, among other things, our financial results, the achievement of the compensation objectives (see discussion beginning on page 44), our relative and absolute TSR and the feedback received from stockholders. Our one year TSR placed us at the top of our peer group, while our three year TSR placed us at the 25th percentile, further illustrating the significant improvement that occurred in our businesses in 2013. Based on 2013 financial results, the Committee and independent board members approved an annual incentive payout of 109.5% of target, after application of the Strategic Modifier. For the 2011 – 2013 CIU long-term incentive award, the Committee approved a CIU payout of $1.50 per unit, after application of the TSR Modifier. The following tables compare the actual payouts in 2013 and 2012.
| | | 2013 Actual Payout | | 2012 Actual Payout | | Percentage change | | Annual Incentive | | Factor as a % of Target | | Factor as a % of Target | | 2013 vs. 2012 | | Financial Objectives | | | 100.5 | % | | | 64.0 | % | | | | | | Strategic Objectives | | | n/a | | | | 11.0 | % | | | | | | Payout Modifier | | | 9.0 | % | | | 0.0 | % | | | | | | Subtotal | | | 109.5 | % | | | 75.0 | % | | | | | | Negative Discretion | | | 0 | % | | | (11.0 | %) | | | | | | Total Payout Factor | | | 109.5 | % | | | 64.0 | % | | | 71.1 | % |
| | | 2013 Actual Unit Payout | | 2012 Actual Unit Payout | | Percentage change | | Long-Term Incentive | | Value (2011 – 2013 cycle) | | Value (2010 – 2012 cycle) | | 2013 vs. 2012 | | Adjusted Earnings per Share | | | $0.83 | | | | $0.62 | | | | | | | Adjusted Free Cash Flow | | | $0.77 | | | | $0.80 | | | | | | | TSR Modifier1 | | | ($0.10 | ) | | | ($0.28 | ) | | | | | | Subtotal | | | $1.50 | | | | $1.14 | | | | | | | Negative Discretion | | | $0.00 | | | | ($0.40 | ) | | | | | | Total Payout Value | | | $1.50 | | | | $0.74 | | | | 102.7 | % |
1 | The TSR Modifier for 2011 – 2013 and 2010 – 2012 CIU cycles is an annual modifier aggregated over each three year cycle, which modifies the final payout by up to +/– 25% based on the company’s TSR as compared to the TSR of companies within the S&P 500. The relative TSR for 2010, 2011, 2012 and 2013 was –10%, –25%,–25%, and +25% respectively. |
See “2013 Compensation” beginning on page 43 of this proxy statement for a discussion of each of the compensation components and the respective payouts.
COMPENSATION DISCUSSION AND ANALYSIS
Pay For Performance Alignment
We have designed our compensation program to link pay with performance.
| • | 2013 Program Design.86% of target total direct compensation for our CEO is variable and is subject to performance metrics. In addition, 69% of target total direct compensation for the other executive officers is variable and subject to performance metrics. In 2014, the LTI mix has been changed to 100% equity based. | | | | | • | 2014 Actual Payout.In 2013, in the aggregate, the company exceeded 100% of its financial targets for its annual incentive and long-term incentive plans. | | | |
| | º | Annual incentive.With respect to its annual incentive targets, the company achieved 98% of its Adjusted earnings before interest & taxes target, 105% of its Adjusted free cash flow target and exceeded threshold on its revenue growth target, with fourth quarter 2013 results showing positive revenue growth for the first time in recent years. These results supported a payment for achievement of financial objectives of 100.5% of target. The Committee awarded a 9.0% strategic modifier add-on in connection with the company’s achievement of strategic goals including improved client satisfaction and implementing a culture change. The combination of financial and strategic performances resulted in a payment of 109.5% of target. The previous year annual incentive payout was 64% of target. | | | | | | | º | Long-term incentive.With respect to its long-term incentive targets, the company achieved an average of 110% of target for the Adjusted earnings per share metric and an average of 109% of target for the Adjusted free cash flow metric over the three-year award cycle. This level of performance supported a CIU payout of $1.60 per unit. However, in applying the company’s TSR Modifier, which compares the company’s TSR to the TSR of S&P 500 companies over the three year cycle, the Committee reduced the payout to $1.50 per unit. Although the TSR for 2013 placed us fifth among S&P 500 companies, the TSR applicable to the long-term incentive award for 2011-2013 compares the company’s TSR to the TSR of S&P 500 companies in each of the cycle years. |
COMPENSATION DISCUSSION AND ANALYSIS Executive Compensation Program Structure Compensation Philosophy We link executive compensation to the performance of the company as a whole. We believe executives with higher levels of responsibility and a greater ability to influence enterprise results should havereceive a greater percentage of variable totalperformance-based compensation. Compensation for our NEOs varies from year to year primarily based on achievement of enterprise-wide objectives and individual performance. We emphasize enterprise-wide performance to break down any internal barriers that can arise in organizations that emphasize individual performance. Our executive compensation program is designed to recognize and reward outstanding achievement and to attract, retain and motivate our leaders. In addition, we directly engaged with many of our stockholders in 2013 toWe solicit feedback onfrom our major stockholders regarding our executive compensation program, and management speaks individually to stockholders who wish to provide input. The Committee considers stockholder feedback to determine whether changes to the executive compensation programs are required. The Committee continually reviews the executive compensation programs to ensure they are appropriately alignedproper alignment with stockholder interests. Below is an overview of key aspects of our pay philosophy. | Overall Objectives | • | Compensation levels should be sufficiently competitive to attract and retain talent; | | | • | Compensation should reflect leadership position and responsibility; | | | • | Executive compensation should be linked to the performance of the company as a whole; | | | • | Compensation should motivate our executives to deliver theour short and long-term business objectives and strategy; and | | | • | Compensation packages should be designed to preserve tax deductibility; however, this should not be the sole objective. | | Pay Mix Principles | • | Compensation should be tied to short-term performance and creation of long-term stockholder value and return; | | | • | Performance-based compensation should be a significant portion of total compensation for executives with higher levels of responsibility and a greater ability to influence enterprise results; and | | | • | Incentive compensation should reward both short-term and long-term performance; and | | • | Executives should own meaningful amounts of Pitney Bowes stock to align their interests with Pitney Bowes stockholders. | Pay for
Performance | • | Incentive compensation should reward both short-term and long-term performance; | | • | A significant portion of our compensation should be variable based on performance.performance; and | | | • | The annual and long-term incentive components should be linked to operational outcomes, financial results or stock price performance: | | | | º | Annual incentive compensation is earned only if pre-determined financial objectives are met; | | | | º | Performance-based cash incentivePerformance stock units (PSUs) are earned only if certain financial objectives are met and which can beunits earned are modified plus or minus 25% based on relative performance of the company compared with our peer group over a cumulative three-year period; and | | | | º | Performance-based restricted stock units and cash incentive unitsPSUs are earned only if a threshold financial target is met for IRC 162(m) purposes.met. |
COMPENSATION DISCUSSION AND ANALYSIS Pay Governance Practices We Designbelieve our Compensation Mixexecutive compensation program demonstrates a strong link between pay and performance in its design and exhibits strong governance pay practices. The following lists the principal pay for performance and governance practices adopted by the board. wIndependent Chairman of board of directors wIndependent Compensation Consultant
performing no other services for the company wAnnual stockholder advisory vote on executive
compensation | w100% of annual incentive and long-term
incentive tied to financial metrics w100% of long-term incentive is equity-based w3-year cumulative relative TSR modifier wNo employment agreements with our executive officers wNo special arrangement crediting extra years of
prior service for our pension plans | | Strong
Pay Governance
Practices | | | |
wAnnual risk-assessment of pay practices
wDirect line of communication between board of
directors and stockholders wProhibition against hedging and pledging of stock wEnhanced disclosure of performance targets |
wNo tax gross-ups in change-of-control payments
wDouble-trigger vesting provisions in our change-of-control arrangements wSignificant stock ownership guidelines for senior executives and directors w“Clawback” policy for senior executives |
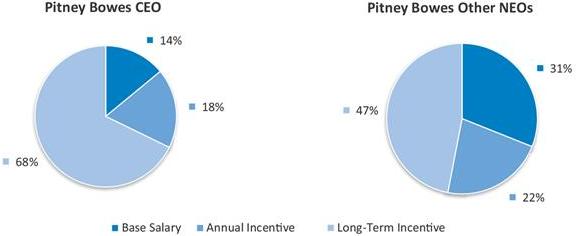
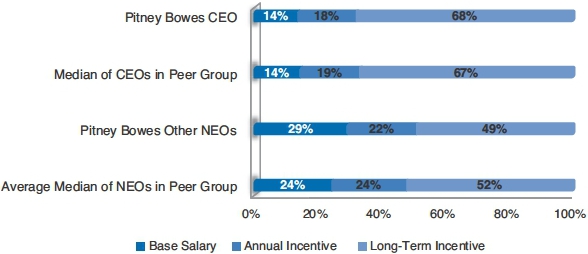
Focus on Variable Pay The chart below shows the 20132014 targeted compensation mix for the CEO and other NEOs compared with the targeted average compensation of our peer group as reported in their 20132014 proxy statements. As illustrated in the chart, our compensation is (i) well aligned to the compensation mix of our peer group and (ii) predominantly variable. The specific proportion of each compensation element below may change with changes in market practicepractices or performance considerations. 
This chart does not include special stock option and stock grants made to the CEO and other NEOs upon hire. COMPENSATION DISCUSSION AND ANALYSIS We design the mix of short and long-term incentives to reward and motivate short-term performance, while at the same time providing significant incentives to keep our executives focused on longer-term corporate goals that drive stockholder value. In addition, we believe this balance of short-term and long-term incentive compensation and mix of performance criteria helps mitigate the incentive forto discourage executives to takefrom taking excessive risk that may have the potential to harm the company in the long-term. We monitorreview the compensation structure annually to make sure that it does not incentivizeencourage excessive risk taking and report our findings to the Committee. In determining our executive’s grant levels, we take into consideration the following: internal pay equity;
level of experience and skill;
individual performance compared to established financial, strategic, unit or individual objectives;
market competitive compensation rates for similar positions; and
the need to attract and retain executive talent during this period of transition.
| • | market competitive compensation rates for similar positions; | | • | individual performance compared to established financial, strategic, unit or individual objectives; | | • | level of experience and skill; | | • | the need to attract and retain executive talent during this period of transition; and | | • | internal pay equity; |
Due to the qualitative nature of these considerations, we do not assign specific weightings or numerical goals to them. Overview of Compensation Components The Committee is responsible for determining the compensation for all NEOs, other than the CEO, and for recommending to the board of directors each specific element of compensation for the CEO. The Committee considers recommendations from the CEO regarding the compensation of the other NEOs. The independent board members are responsible for determining the CEO’s compensation. No member of the management team, including the CEO, has a role in determining his or her own compensation. For each NEO, the Committee sets, as a guideline, target total direct compensation levels so the base salary, total cash compensation, and total direct compensation is at +/– 20% of the median of the competitive data based on the Towers Watson Regressed Compensation Report, as regressed for companies approximately our size, and the Radford High-Tech Industry Survey focusing on companies with revenue scopes similar to ours for each position. We describe these two reports in more detail under “Assessing Competitive Practice” beginning on page 5150 of this proxy statement. In order to attract specific talent, the general +/– 20% of the median guideline may be exceeded. For 2013,2014, the total target cash compensation (base salary plus annual incentive) and total target direct compensation (base salary plus annual incentive plus long-term incentive) for Mr. Lautenbach were 88%90% and 92%98%, respectively, of the average of the Survey Reports market median(1)for chief executive officers.CEOs. For the NEOs, as a group, the average total target cash compensation and total direct compensation were 107%105% and 108%110%, respectively, of the average of the Survey Reports.market median(1). | (1) | Market median is the average of the median CEO pay as reported in the Towers Watson Regressed Compensation Report and the Radford High Tech Industry Survey. For NEO pay, market median is the average of the Towers Watson Regressed Compensation Report and the Radford High Tech Industry Survey average median of NEO pay. |
COMPENSATION DISCUSSION AND ANALYSIS The following table outlines the components of direct compensation for our NEOs and how they align with our compensation principles. | | | | How it Aligns | | Fixed or | | Cash or | | What it Rewards | | With Our Principles | | Performance-Based | | Equity | | Base Salary | •
• | Performance of daily job duties
•Highly developed skills and abilities critical to the success of the company | • | •Competitive in the markets in which we operate enabling us to attract and retain executive talent | •
• | •Fixed compensation
•Increases influenced by executive’s individual performance rating | • | •Cash | | Annual Incentive | • | Achievement of pre-determinedpre- determined short-term objectives established in the first quarter of each year | •
•
• | •Competitive incentive targets enable us to attract and retain executive talent
•Payout dependent on achievement of objectives aligning pay to performance
•Subject to a “clawback” (See “Clawback Policy” on page 53 of this proxy statement) | •
•
• | •Performance-based compensation primarily measured on achievement of enterprise-wide metrics
•Individual performance may be considered in establishing executives’ annual incentive opportunity
•Up to a maximum of $4,000,000 per NEO granted under the Key Employees Incentive Plan (KEIP) | • | •Cash | | Long-term Incentives | | | Cash Incentive Units (CIUs) (60% in 2013; eliminated in 2014)after 2013(1)) | •
• | Achievement of pre-determinedpre- determined long-term objectives and annual objectives established in the first quarter of the first year and the first quarter of each year, respectively, of the three year cycle
•Change in company’s stock price versus S&P 500 companies for the 2011-2013 CIU award and versus the company’s peer group for the 2012-2014 CIU award payout | •
•
• | •Payout dependent on achievement of long-term objectives aligning pay to long-term performance
•The resulting unit value is modified by up to +/–25% based on TSR. For the CIU award cycle 2011-2013, the company’sa 3-year cumulative TSR wasas compared to thea 3-year cumulative TSR of companies within the S&P 500. For subsequent CIU award cycles, the comparison is to the company’sour peer group. The application of the TSR Modifier links the CIU payout to stockholder return versus the comparator group of companies. TSR Modifier cannot beresult in a positive adjustment if there is a negative TSR over the three-year cycle
•3-year performance period cycle thereby promotingpromotes retention | •
• | •Performance-based compensation measured on enterprise-wide metrics
•Up to a maximum in any one year of $8,000,000 per NEO granted under the KEIP | • | | •Cash | | (1)There is one more CIU award outstanding, for the 2013-2015 cycle, which will be paid out in 2016. | Performance Stock Units (PSUs) (0% in 2013; 70%(70% in 2014) | •
• | Achievement of pre-determinedpre- determined long-term objectives and annual objectives established in the first quarter of the first year and the first quarter of each year, respectively, ofin the three year cycle
•Change in company’s stock price compared to peer group starting in 2014 | •
• | •Shares vested dependentdepend on achievement of long-term objectives aligning pay to performance
•The resulting number of shares vested is modified by up to +/-25%–25% based on a 3-year cumulative TSR as compared to a 3-year cumulative TSR of our peer group, further linking compensation to stockholder return. TSR Modifier cannot beresult in a positive adjustment if there is a negative TSR over the three-year cycle • 3-year performance period cycle promotes retention | •
• | •Performance-based compensation measured on enterprise-wide metrics
•Up to a maximum of 1,200,000 shares including RSUs per NEO in any plan year granted under the 2013 Stock Plan | • | Equity | | | • | 3-year performance period cycle thereby promoting retention | | | | Equity |
COMPENSATION DISCUSSION AND ANALYSIS | | | | How it Aligns | | Fixed or | | Cash or | | What it Rewards | | With Our Principles | | Performance-Based | | Equity | | | Performance-Based Restricted Stock Units (RSUs) (40% in 2013; 30%(30% in 2014) | | | •
• | Achievement of a pre-determinedpre- determined performance objective established at the time of grant
•Company stock value | •
•
• | •Vesting dependent on achievement of a pre-determinedpre- determined performance objective aligning pay to performance
•3-year pro-rata vesting beginning 2014 thereby promotingpromotes retention for executives; 4-year pro-rata vesting in 2013
executives •Award value linked to company’s stock price | •
• | •Performance-based compensation measured on a threshold financial target for IRC 162(m) purposes
•Up to a maximum of 1,200,000 shares including performance stock unitsPSUs per NEO, in any plan year granted under the 2013 Stock Plan | • | •Equity | Long-term Incentives | | | Market Stock Units (MSUs) (granted only in 2012) | •
• | Achievement of a pre-determinedpre- determined performance objective established at the time of grant
•Company stock value | •
•
• | •Vesting dependent on achievement of a pre-determinedpre- determined performance objective aligning pay to performance and on formula based on TSR over the three-year cycle
•3-year cliff vesting thereby promotingpromotes retention
•Award value linked to company’s stock price | •
• | •Performance-based compensation measured on a threshold financial metric for IRC 162(m) purposes
•Up to a maximum number of shares per NEO (600,000 in 2012), including grants of RSUs, in any plan year granted under the 2007 Stock Plan | • | •Equity | | Periodic Off-cycle Long-term Awards | • | The Committee may also grant other long-term incentive awards in unique circumstances where needed for attracting, retaining or motivating executive talent | • | •All long-term incentives are subject to a “clawback” (See “Clawback Policy” on page 53 of this proxy statement) | • | •Depends on award granted | • | •Cash or Equity |
We also provide certain other benefits for our NEOs, including retirement benefits and deferred compensation plans. For additional information, please see “Other Indirect Compensation” on page 48 of this proxy statement. 20132014 Compensation
Overview In February 2013,2014, the Committee implemented changes to the compensation program in response to feedback received fromemphasizing further alignment of executive compensation with the company’s stockholders. TheseWe increased the percentage of equity awards in the company’s long-term compensation plan, implemented changes to executive stock ownership requirements, and instituted a deferral program to facilitate a quicker path to executive stock ownership. In addition the company used a net promoter score (a universal metric for client satisfaction) as part of its strategic modifier to the annual incentive program. The strategic modifier can increase the annual incentive pay-out by up to ten percentage points. The changes ensured a stronger link betweenmade in 2014 built on the significant changes the company financial performance and executivemade to its compensation and will be reflected beginning with the February 2014 payouts.programs in 2013.
Base Salary In February 2013,2014, based on the business results for 2012,2013, the Committee and the independent directors frozeincreased the CEO’s base salaries for the CEO and the NEOs. Thesalary by 6%, bringing his company also imposed a freezebase salary closer to market median based on thecompetitive benchmarks. NEOs, excluding CEO, base salaries of the broad-based employee population.salary increases averaged 2.8%.
COMPENSATION DISCUSSION AND ANALYSIS Annual Incentives NEOs are eligible for annual incentives under the KEIP primarily for achieving challenging enterprise-wide financial objectives established at the beginning of each year. Individual performance and its impact on financial, strategic, unit or individual objectives may be considered.
20132014 Annual Incentive Objectives and Metrics
In 2013,2014, 100% of the annual incentive was based on financial objectives which are shown in the chart below. The chart also shows the threshold, target, and maximum ranges. | Financial Objectives | Weighting | Threshold | Target | Maximum | Weighting | Threshold | Target | Maximum | Adjusted Earnings Before
Interest and Taxes(1) | 35% | $673 million | $727 million | $779 million | 35% | $672 million | $718 million | $775 million | | | | | | | | Revenue Growth(1) | 25% | –1.2% | 0.6% | 2.8% | | | | | | | | | Adjusted Revenue Growth(1) | | 25% | –1.0% | 0.5% | 2.0% | | Adjusted Free Cash Flow(1) | 40% | $573 million | $623 million | $673 million | 40% | $400 million | $440 million | $500 million |
| (1) | Adjusted earnings before interest and taxes, Revenueadjusted revenue growth and Adjustedadjusted free cash flow are non-GAAP measures. For a reconciliation and additional information, please see “Accounting Items and Reconciliation of GAAP to Non-GAAP“Non-GAAP Measures” on page 55 of this proxy statement. | | Threshold, target and maximum amounts have been restated to exclude PBMS, IMS, and Nordic furniture.reflect the sale of the Canada DIS business. |
We believe that together these financial objectives effectively measure how well our business is performing on a short-term basis and thus represent appropriate metrics upon which to base annual incentive awards. In 2012 our stockholders expressed concern regardingWe limited the number of duplicative financial metrics in our shortacross annual and long-term compensation programs. In response to that concern, we replaced the earnings per share metric with an Adjusted earnings before interest and taxes metric for the 2013incentives. The 2014 annual incentive program.program includes the following metrics and the reasons why they are important to company performance. Adjusted EBIT is a stronger measure for annual incentive compensation because it more directly reflects current profitability and performance.
Revenue growth is an appropriate measure because it indicates whether our business is expanding.
Adjusted free cash flow is an appropriate measure of the company’s ability to pursue discretionary opportunities that enhance stockholder value.
| • | Adjusted earnings before interest and taxes. This is an appropriate measure for annual incentive compensation because it directly reflects current profitability and performance. | | | | | • | Adjusted revenue growth. This is an appropriate measure because it indicates whether our business is expanding, after excluding the impact of foreign currency translation and the disposal of certain business operations. | | | | | • | Adjusted free cash flow. This is an appropriate measure of the company’s ability to pursue discretionary opportunities that enhance stockholder value. |
Each of these metrics excludeexcludes the impact of certain special items, both positive and negative, which could mask the underlying trend or performance within a business. The adjustments for special items are made consistently year-to-year and are explained on page 55 in “Non-GAAP Measures.” Adjusted free cash flow is the only metric that we use in both our annual and long-term incentive program. We believe that the ability to generate free cash flow allows the company to manage its current financial needs and is central to the company’s future health and ability to take advantage of growth opportunities as they are presented. Free cash flow is also a strong contributor to long-term stockholder value. We set the targets for the Adjustedadjusted earnings before interest and taxes and Adjustedadjusted free cash flow financial objectives at approximatelyclose to the midpoint of our guidance provided to stockholders and the financial community at the beginning of 2013. We set the target for 2013 revenue at the lower end of guidance because we believed achieving that goal would be challenging in light of continuing uncertainties in the core business environment and the transformational changes being made inside the company.2014. The only revision to targets during the course of the year reflected the revision to guidance announced as a result of the sale of PBMS, IMS and our Nordic furniturethe Canada Document Imaging Solutions (DIS) business. We believe that the 20132014 financial objectives at each level (threshold, target and maximum) accurately balance the difficulty of attainment of the level with the related payout. In 2013, we increased the weighting of theThe 2014 annual incentive plan design includes 100% financial metrics, to be 100%, from 70%, of the annual incentive design. This demonstratesdemonstrating our commit- mentcommitment to place more rigor and objectivity in the payoutsestablishing and reflects stockholder feedback. While strategicmeeting our compensation goals. Strategic metrics did not play a primary role in the annual incentive design, we included these important goals(Strategic Modifier) are applied as a zero to 10% modifier to the ultimate payout.compensation payouts by up to ten percentage points. Strategic goals are targets that are important to the successful operation of the enterprise above and beyond financial goals. The strategic goals for 20132014 included improving(i) employee engagement and (ii) client satisfaction andsatisfaction. Employee engagement is meant to measure, through employee surveys, the company’s progress toward implementing a culture change throughouthigh-performance client-oriented culture. Client satisfaction is measured by the organization.implementation and progress made against a net promoter score, a universal metric utilized to measure client satisfaction. These important strategic goals are the foundation for our future business success. Depending on the achievement of the strategic goals, the annual incentive multiplier may be increased by 0% to 10%.success and essential for positive financial results.
Funding of the Annual Incentive Pool and 20132014 Actual Payout Funding of the annual incentive pool begins with the sum of the annual incentive targets of eligible Pitney Bowes Incentive Plan (PBIP) participants. For more information on setting the target see “Assessing Competitive Practice” on page 51.50. After the close of the
COMPENSATION DISCUSSION AND ANALYSIS calendar year, the Committee determines the company’s achievement of the overall financial results against each metric (see above) and approves a multiplier to be applied to the sum of the annual incentive targets. For NEOs, executive officers, unit presidents and staff vice presidents the annual incentive is only paid if the company achieves its IRC 162(m) threshold target of $276,086,000$256,583,000 in income from continuing operations, as restated excluding certain special events. (See “Treatment of Special Events” beginning on page 55 of this proxy statement.) This target was established to allow payments under the annual incentive program to qualify as performance-based compensation for purposes of IRC 162(m) target is an additional target intended to ensure tax deductibility of compensation paid.. Actual 2013 Adjusted2014 adjusted income from continuing operations, excluding all special events, was $380,668,000.$387,414,000. The IRC 162(m)initial threshold targetof adjusted income from continuing operations was restatedadjusted to exclude the PBMS, IMSsale of the Canada DIS business. The adjustment was made according to predetermined definitions when the target was originally established and Nordic furniture businesses sold.is also reflected in actual results. The chart below shows actual financial results and the payout as compared to target.
COMPENSATION DISCUSSION AND ANALYSIS
| Objectives | Target Weighting | Actual Result | Actual Payout as a % of Target | Target Weighting | Actual Result | Actual Payout as a % of Target | | Financial Objectives: | | | | | | | | Adjusted Earnings Before | 35% | $714 million | 32.4% | | | Interest and Taxes(1) | | | | | | Revenue Growth(1) | 25% | (-0.8%) | 19.0% | | Adjusted Earnings Before
Interest and Taxes(1) | | 35% | $731 million | 37.8% | | Adjusted Revenue Growth(1) | | 25% | 1.6% | 31.4% | | Adjusted Free Cash Flow(1) | 40% | $655 million | 49.0% | 40% | $467 million | 46.4% | | Total | 100% | n/a | 100.5% | 100% | n/a | 115.7% |
| (1) | For compensation purposes, (a) adjusted earnings before interest and taxes excludes the impact of foreign currency translation; (b) adjusted revenue growth excludes the impact of foreign currency translation and the disposal of certain business operations; and (c) adjusted free cash flow excludes reserve account deposits and changes in finance receivables. Adjusted EBIT, Revenueearnings before interest and taxes, adjusted revenue growth and Adjustedadjusted free cash flow are non-GAAP measures. For a reconciliation and additional information, on the adjustments, please see “Accounting Items and Reconciliation of GAAP to Non-GAAP“Non-GAAP Measures” beginning on page 55 of this proxy statement. |
The Committee compared the 20132014 performance against the financial targets and approved a 20132014 annual incentive multiplier of 100.5%115.7%. Next the Committee assessed the predetermined strategic goals for 20132014 which included improving client satisfaction and implementing aemployee engagement and culture change throughout the organization. With respect to the client satisfaction goal, the Committee noted that the company successfully implemented the Net Promoter Score (NPS) universal metric across four key business units, established a baseline metric and a monthly management process. The Committee also noted that the company showed improvement among four core relationship drivers - sales support, products and services, customer support and customer communications - within those business units. The client satisfaction threshold, target, and maximum objectives were to achieve a 3%, 5% or 10% improvement in these four core relationship drivers in reducing the gap to goal. The company ultimately achieved a 9% improvement | • | With respect to the client satisfaction goal, the Committee noted that the company successfully implemented the Net Promoter Score (NPS), a universal client satisfaction metric, across business units globally. The client satisfaction threshold, target, and maximum objectives were to achieve a 5%, 20% or 30% closure in reducing the gap to goal. NPS is measured on a scale of -100 to +100. Our goal was to achieve an NPS placing us in the top quartile. Our threshold, target and maximum objectives reflect realistic and stretch percentage increases in closing the gap between our baseline score and top quartile results. The company ultimately achieved a 28% gap closure among business units globally, which was slightly below the maximum achievement of 30% gap closure. | | • | In 2014 the employee engagement and culture metrics included the following survey dimensions: Employee Engagement, Sustainable Engagement, Client Focus and Team. These metrics are measured from employee survey results. Each category is assigned a series of specific questions in the employee survey as developed in conjunction with the company’s outside consultant, Towers Watson. Employee Engagement is a Pitney Bowes-developed metric which measures employees’ commitment to the company. Sustainable |
| | Engagement is a Towers Watson benchmark metric that measures both the employee commitment and ability to execute on behalf of the company. Sustainable Engagement, along with the other Towers Watson developed metrics of Client Focus and Team, allow us to compare ourselves to high performing companies. The Committee noted that the company reached or exceeded the maximum objective for all except one metric. |
| Metric | Maximum | Actual | Employee
Engagement | 6% point
improvement | 11% point
improvement | Sustainable
Engagement | 4% point
improvement | 5% point
improvement | | Client Focus | 5% point
improvement | 5% point
improvement | | Team | 6% point
improvement | 5% point
improvement |
The goals above represent a 15% closure in gap to goal among these relationship drivers, which was slightly below the maximum achievement of 10%100%. In considering the culture metric, the Committee noted that the company far exceeded the maximum objective of achieving 2% improvement in each of the company’s core principles of Client Centricity, Accountability, One Team, Sense of Urgency, and Shared Vision, plus almost achieved the maximum 6% improvement in employee engagement by ending with a 5% improvement in that metric.
Noting the significant progress madeachieved in addressing client satisfaction across the four key business units and achieving outstanding results in implementing a culture change throughout the organization,both strategic metrics above, the Committee, and independent board members with respect to the CEO, added a 9% strategic modifier9.4% Strategic Modifier resulting in a final annual incentive multiplier of 109.5%125.1%. Based on the above analysis, Mr. Lautenbach made recommendations to the Committee for his direct reports. The Committee considered those recommendations and the actual performance against objectives as shown, resulting in the annual incentive awards to our NEOs as follows:
| Executive | | Target Award | | Payout | | Payout Percent to Target | | Marc B. Lautenbach | | $ | 1,105,000 | | | $ | 1,209,975 | | | | 109.5 | % | | Michael Monahan | | $ | 462,720 | | | $ | 506,678 | | | | 109.5 | % | | Abby F. Kohnstamm(1) | | $ | 241,797 | | | $ | 264,768 | | | | 109.5 | % | | Daniel J. Goldstein | | $ | 286,440 | | | $ | 313,652 | | | | 109.5 | % | | Mark F. Wright | | $ | 300,000 | | | $ | 328,500 | | | | 109.5 | % | | Leslie Abi-Karam | | $ | 444,320 | | | | N/A | | | | N/A | | | Vicki A. O’Meara | | $ | 419,200 | | | | N/A | | | | N/A | |
(1) | Ms. Kohnstamm’s annual incentive is prorated based on her June 17, 2013 start date. |
COMPENSATION DISCUSSION AND ANALYSIS | Executive | Target Award | Payout | Payout Percent to Target | | Marc B. Lautenbach | $1,215,000 | $1,519,965 | 125.1% | | Michael Monahan | $485,856 | $607,806 | 125.1% | | Abby F. Kohnstamm | $448,000 | $560,448 | 125.1% | | Mark L. Shearer | $457,320 | $572,107 | 125.1% | | Daniel J. Goldstein | $295,033 | $369,087 | 125.1% |
Long-term Incentives Long-term incentives link the NEOs’ long-term rewards to ourthe company’s long-term financial performance and our stock price performance.price. We also pay long-term incentives in order to be competitive in the markets in which we operate and in order to attract and retain high-performing executives. In 2013,2014, in order to tie executive rewards closer to changes in shareholder value, the Committee changed the design mix for the 2014 LTI awards to 100% equity (70% PSUs and 30% performance-based RSUs) to further align long-term incentives with long-term stockholder interests. As a result, all of the long-term incentive mix consisted of 60% CIUs and 40% RSUs.executive compensation structure will be impacted by changes in company stock price. PSUs, which the Committee decided will be granted in place of CIUs beginning in 2014, have many of the same features as the previously granted CIUs, except that the PSUs are based on and settled in stock instead of cash. The new LTI mix of 100% equity further aligns the LTI program with market best practices. In addition, the vesting period for the RSUs was changed from four years to three years to better align with the company’s strategic plan. As a result of the way equity-based PSUs and cash-based CIUs are reported on the Summary Compensation Table, beginning in 2014, you will see a “bunching” of award values. The outstanding and previously granted cash-based CIU awards will continue to be reflected as required under SEC rules when paid, but the equity denominated PSUs are required to be reported when granted. Although it may appear from a review of the Summary Compensation Table that the total value of LTI has increased, in fact, it only reflects the different timing of when cash versus equity is reported in accordance with SEC requirements. Since outstanding and previously awarded CIUs will continue to vest through 2016, this “bunching” effect also will continue through 2016. Cash Incentive Units (CIUs) CIUs are long-term cash awards granted annually prior to 2014 with three year performance and vesting cycles. The vesting of long-term incentive awards are generally subject to achieving an initialaverage income from continuing operations (IFCO) financial threshold target over the cycle period, established for purposes of IRC 162(m). At any given time there are three cycles outstanding. NEOs are awarded CIUs with payouts based on achieving challenging enterprise-wide financial objectives established at the beginning of each individual year of the three-year cycle. If the threshold level of performance isfor the enterprise-wide financial objectives are not met for a calendar year, for both of these goals, one-third of the award value will be forfeited. Beginning with the 2014 – 2016 cycle, we have eliminated this component of LTI compensation and replaced it with Performance Stock Units,PSUs, discussed below. As a result, the last remaining CIU award cycle will end in 2015 and is payable in 2016. The enterprise-wide financial objectives set by the Committee believes that Adjustedinclude adjusted earnings per share and Adjustedadjusted free cash flowflow. We believe both of these financial factors are important indicators of our the company’s long-term viability and performance and thus are appropriate metrics upon which to base long-term incentive awards. Adjusted earnings per share is an appropriate measure of long-term profitability, and a strong Adjustedadjusted free cash flow provides us with theneeded resources we need to reposition and pursue new growth opportunities.
The Committee generally sets the financial targets atclose to the midpoint of the guidance we provide to stockholders and the financial community at the beginning of each year. Subsequent revisions of guidance during the course of the year do not affect the targets set at the beginning of a year. Before finalizing payouts, the Committee comparesranks the company’s cumulative three-year TSR to aagainst the cumulative three-year TSR of each company in the company’s peer group. The Committee believes it setsset the 20132014 objectives as it relates to previously awarded CIUs with the appropriate level of difficulty and stretch for each target.
COMPENSATION DISCUSSION AND ANALYSIS CIU Objectives and Metrics The 20112012 – 20132014 financial objectives, each weighted at 50%, are stated below: | 2011 – 2013 LTI Adjusted Earnings Per Share(1) | Threshold | Target | Maximum | | | 2011 | $1.78 | $2.23 | $2.27 | | | 2012 – 2014 LTI Adjusted Earnings Per Share(1) | | Threshold | Target | Maximum | | 2012 | $1.72 | $2.15 | $2.19 | $1.72 | $2.15 | $2.22 | | 2013 | $1.53 | $1.71 | $1.88 | $1.53 | $1.71 | $1.88 | | | | | | 2011 – 2013 LTI Adjusted Free Cash Flow(1) | Threshold | Target | Maximum | | | 2011 | $729 | $819 | $850 | | | 2012 | $684 | $760 | $790 | | | 2013 | $573 | $623 | $673 | | | 2014 | | $1.60 | $1.76 | $1.95 |
| 2012 – 2014 LTI Adjusted Free Cash Flow(1) | Threshold | Target | Maximum | | 2012 | $684 | $760 | $790 | | 2013 | $573 | $623 | $673 | | 2014 | $400 | $440 | $500 |
| (1) | Adjusted earnings per share and Adjustedadjusted free cash flow (in millions) are non-GAAP measures. For a reconciliation and additional information on the adjustments, please see “Accounting Items and Reconciliation of GAAP to non-GAAP“Non-GAAP Measures” beginning on page 55 of this proxy statement. |
20132014 Funding of the Cash Incentive Unit Pool and Actual Payout
For the 20112012 – 20132014 CIU cycle, the unit value at target is $1.00. The CIU value range is between $0 and $1.80$2.00 based upon the achievement of the pre-determined financial objectives described above, each weighted at 50%. The Committee modifies the resulting unit value by up to +/– 25% based on our cumulative three-year TSR as compared toranked against the cumulative three-year TSR of companies within the S&P 500, thereforeour peer group linking payout to our relative TSR. For NEOs, executive officers, unit presidents and staff vice presidents the 20112012 – 20132014 CIU cycle is only paid if the company achieves anthe restated IRC 162(m) threshold target of average income from continuing operations over the cycle of $298,086,000,$339,706,000, excluding certain special events. (See “Treatment of Special Events” beginning on page 55 of this proxy statement.) Adjusted averageAverage annual income from continuing operations for the 20112012 – 20132014 CIU cycle was $377,264,000, which exceeded the threshold and was $426,332,000.performance threshold. The IRC 162(m) threshold target for adjusted income from continuing operations on the 2011for 2012 – 2013 period2014 was restated to exclude PBMS, IMS and Nordic furniture.
COMPENSATION DISCUSSION AND ANALYSIS
eliminate the impact of disposal of certain business operations, in accordance with predetermined definitions of income from continuing operations. The chart below shows actual results as compared to target before and after applying the TSR Modifier for the 2011 – 20132012 - 2014 cycle.
| | | Metric | | Final | | | Objectives | Actual Result | Payout Value | TSR Modifier | Payout Value | Actual Result | Metric
Payout Value | TSR Modifier | Final
Payout Value | | 2011 – 2013 LTI Adjusted | | | | | | Earnings Per Share(1) | | | | | | 2011 | $2.70 | $0.30 | (25%) | $0.23 | | 2012 – 2014 LTI Adjusted
Earnings Per Share(1) | | | | | | 2012 | $2.16 | $0.20 | (25%) | $0.15 | $2.16 | $0.19 | | | | 2013 | $1.88 | $0.33 | 25% | $0.41 | $1.88 | $0.33 | | | | 2011 – 2013 LTI Adjusted | | | | | | Free Cash Flow(1) | | | | | | 2011 | $994 million | $0.30 | (25%) | $0.23 | | | 2014 | | $1.95 | $0.33 | | | 2012 – 2014 LTI Adjusted
Free Cash Flow(1) | | | | | | 2012 | $767 million | $0.20 | (25%) | $0.15 | $767 million | $0.20 | | | | 2013 | $655 million | $0.27 | 25% | $0.34 | $655 million | $0.27 | | | | 2014 | | $467 million | $0.24 | | | | Total | | $1.60 | | $1.50 | | $1.56 | (15%) | $1.33 |
1)(1) | AdjustedFor compensation purposes, (a) adjusted earnings per share includes the benefit received from the company’s divestiture of a partnership investment; and (b) adjusted free cash flow excludes reserve account deposits and changes in finance receivables. Adjusted EPS and adjusted free cash flow are non-GAAP measures. For a reconciliation and additional information, on the adjustments, please see “Accounting Items and Reconciliation of GAAP to Non-GAAP“Non-GAAP Measures” beginning on page 55 of this proxy statement. The sum of the Adjusted earnings per share and Adjusted free cash flow may not equal the totals due to rounding. |
COMPENSATION DISCUSSION AND ANALYSIS The TSR Modifier in aggregate decreased the CIU pay-out level for the 20112012 – 20132014 cycle by 6%-15%. The CIU payout in February 2014,2015, for 2011-2013the 2012 – 2014 cycle, was $1.50.$1.33 per unit. This compares to the 2010-20122011 – 2013 cycle pay-out which was $0.74, after the Committee applied negative discretion.$1.50 per unit. Performance-Based Restricted Stock Units An annual grant of performance-based restricted stock units (RSUs) is made during the first quarter of the year. For NEOs, executive officers, unit presidents and staff vice presidents, no performance-based restricted stock units (RSUs)RSUs will vest unless the company achieves itsat least the IRC 162(m) threshold target of $276,086,000$256,583,000 income from continuing operations, as restated excluding certain special events. (See “Treatment of Special Events” beginning on page 55 of this proxy statement.) Actual 2013 Adjusted2014 income from continuing operations, excluding all special events, was $380,668,000,$387,414,000, which exceeded the target. The IRC 162(m) threshold targets for income from continuing operations and actual 20132014 income from continuing operations were restatedadjusted to exclude PBMS, IMS and Nordic furniture.eliminate the impact of the disposal of certain business operations in accordance with the predetermined definition of income from continuing operations. In 2014, the percentage of the long-term incentive award made up by RSUs was reduced from 40% to 30%. The 20132014 award vests in fourthree equal installments commencing on the first anniversary of the grant date if the executive is still employed on the vesting date. If the initial thresholdincome from continuing operations target had not been achieved, the performance-based RSUs granted in 20132014 would have been forfeited. Performance Stock Units (PSUs) Beginning in 2014, PSUs replaced CIUs, making the company’s long-term incentive mix entirely equity based. PSUs are long-term equity awards granted annually with three year performance and vesting cycles. At any given time after three years of PSU awards there will be three PSU cycles outstanding. The vesting of long-term incentive awards are generally subject to achieving an average IFCO financial threshold target established for purposes of IRC 162(m). If the average IFCO target is not met, then the entire award is forfeited. In addition, vesting of PSUs are based on achieving various challenging enterprise-wide financial objectives established at the beginning of each year of the three-year cycle. If the enterprise-wide financial objectives are not met for a calendar year, one-third of the award will be forfeited. The enterprise-wide financial objectives set by the Committee include adjusted earnings per share and adjusted free cash flow. We believe both of these financial factors are important indicators of the company’s long-term viability and performance and thus are appropriate metrics upon which to base long-term incentive awards. Adjusted earnings per share is an appropriate measure of long-term profitability, and strong adjusted free cash flow provides us with needed resources to reposition and pursue new growth opportunities. The Committee generally sets the financial targets close to the midpoint of the guidance we provide to stockholders and the financial community at the beginning of each year. Subsequent revisions of guidance during the course of the year do not affect the targets set at the beginning of a year. Before finalizing payouts, the Committee ranks the company’s cumulative three-year TSR against the cumulative three-year TSR of each Company in the peer group and can adjust the final payout by plus or minus 25%. The TSR modifier cannot result in a positive adjustment if there is a negative TSR over the three-year cycle. The Committee believes it set the 2014 objectives with the appropriate level of difficulty and stretch for each target. The number of PSUs granted at target is determined using Monte-Carlo simulation modelling. Monte-Carlo simulation modelling is a generally accepted statistical technique used, in this instance, to simulate a range of possible future prices for Pitney Bowes common stock based on various inputs, including stock volatility, dividend yield, expected term, and risk-free rates. The number of shares vesting at the end of the cycle can range from 0 to 200% of the initial number granted based on achievement of the Committee approved financial goals and application of the cumulative three-year TSR modifier. The Committee also can employ negative discretion to reduce the payout even if the financial goals are achieved based on overall company performance. Performance-Based Market Stock Units Performance-based market stock units (MSUs) were granted to executive officers, including NEOs, in February 2012 for the first and only time. In 2013, the Committee determined that MSUs would no longer be a part of the company’s executive compensation structure. The number of MSUs that can vest is capped at 200% of the number of MSUs originally granted. A minimum number of shares, comprising 50% of the award, will vest at the end of the three-year performance period. Because the IRC 162 (m) threshold target was achieved, the 2012 award will vest on the third anniversary of the grant date. The number of performance-based MSUs that will vest at that time is contingentbased on our(i) the company’s TSR over the vesting period and (ii) the executives’ continued employment until the vesting date. The vesting percentagenumber of units which will vest is determined by multiplying the number of units awarded by a fraction, the numerator of which is the Pitney Bowes ending stock price, $24.011(1), plus cumulative dividends paid on outstanding company stock during the vesting period, $3.19, and the denominator, of which is the Pitney Bowes beginning stock price.price, $19.262(2)
In 2013, the Committee determined that MSUs would no longer be a part. Vesting of the MSU awards was also based on the company’s executive compensation structure.achievement of an IFCO target, $383,665,000, in the initial year of the award, which was met. Based on the company’s TSR over the award period, a multiplier of 1.41 was applied to the target number of 2012 MSU awards.
| (1) | Pitney Bowes ending stock price is the average of the closing price of company stock for the 20 trading days ending on the last day of the month prior to the vesting date. |
| (2) | Pitney Bowes beginning stock price is the average of the closing price of company stock for the 20 trading days ending with the grant date. |
COMPENSATION DISCUSSION AND ANALYSIS Periodic Off-Cycle Long-Term Awards In special circumstances, the Committee, or in the case of the CEO, the independent board members, may determine that it is appropriate to make additional long-term award grants to executives during the course of the year. In February 2013,some cases, these awards are part of the independent board members awardedlong-term incentive awards made to hires during the secondcourse of a calendar year, and final tranche of premium-priced stock options promised to Mr. Lautenbach upon commencement of his employment in December 2012. These options were awarded at a 160% premiumother cases, these awards are in addition to the award date stock price. long-term incentive awards made in any given year. In July 2013,February 2014, the Committee awarded a one-time grantan additional tranche of 400,000 premium-priced stock options,RSUs to Ms. Kohnstamm that was promised in connection with her hiring in 2013. The additional tranche is subject to an adjusted income from continuing operations performance metric with a premium ranging from 115% to 160% of the award date stock price, to Mr. Monahan for retention purposes.one-year vesting provision. See details of the grants for Mr. Lautenbach and Mr. Monahanto Ms. Kohnstamm in the “Grants of Plan-Based Awards in 2013”2014” table on page 59 of this proxy statement. In June 2014, LTI Design Mix In November 2013, reflectingMs. Kohnstamm was awarded the tenorsecond half of comments made by stockholders, the Committee changed the design mix for the 2014 LTI awards to 100% equity to further align long-term incentivesher cash sign-on award in connection with long-term stockholder interests. The 2014 LTI design mix will be 70%
performance stock units (PSUs) and 30% performance-based RSUs, both paid in stock. The long-term executive compensation structure will be entirely impacted by changes in company stock price.
PSUs, which the Committee decided will be granted in place of CIUs beginning in 2014, have many of the same features as the previously granted CIUs, except that the PSUs are based on and settled in stock instead of cash. The new LTI mix of 100% equity further aligns the LTI program with market best practices. In addition, the vesting period for the RSUs was changed from four years to three years.
Because PSUs are equity-based and CIUs are cash-based, beginning in 2014, the Summary Compensation Table will reflect for reporting purposes only a “bunching” of award values. The outstanding and previously granted cash-based CIU awards will continue to be reflected as required under SEC rules when paid, but the equity denominated PSUs are required to be reported when granted. The result will look like the total value of LTI has increased when in fact it only reflects the different timing of when cash versus equity is reported. Since outstanding and previously awarded CIU awards will continue to vest through 2016, this “bunching” effect will continue through 2016.her hiring.
Other Indirect Compensation Retirement Compensation In the United States, retirement benefits include: Qualified and nonqualified restoration pension plans for employees hired prior to January 1, 2005.
Qualified and nonqualified restoration 401(k) plans with company matching contributions up to 4% of eligible compensation and 2% company core contribution for those not eligible for the Pension Plan.
| • | Qualified and nonqualified restoration pension plans for employees hired prior to January 1, 2005. | | • | Qualified and nonqualified restoration 401(k) plans with company matching contributions up to 4% of eligible compensation and 2% company core contribution for those not eligible for the Pension Plan. Participants become eligible for the company matching and company core contributions after one year of employment with the company. |
Nonqualified restoration plans (pension and 401(k)) are based on the same formulas as are used under the qualified plans and make up for benefits that otherwise would be unavailable due tohave been provided under the qualified plan except for limitations set forth under the Internal Revenue Code of 1986, as amended (IRC). Restoration plans are available to a select group of management or highly compensated employees, including the NEOs. Nonqualified plans are unfunded obligations of the company subject to claims by our creditors. TheAn individual account under the 401(k) Restoration Plan: is adjusted on the basis of notional investment returns of publicly-available mutual fund investments; and
does not receive any above-market earnings.
| • | is adjusted on the basis of notional investment returns of publicly-available mutual fund investments; and | | • | does not receive any above-market earnings. |
The Pension Restoration Plan applies the same standard actuarial rules as are applied under the qualified Pension Plan. Effective April 1, 2013,December 31, 2014, the board of directors approved the freezing of all future Pension Plan benefit accruals for employees with fewer than 16 years of service as ofall employees. March 31, 2013. Employees with 16 or more years of service on March 31, 2013 will continue to accrue pension benefits through December 31, 2014, after which date no further benefits will accrue under the Pension Plan.
Similar amendments were adopted with respect to the Pension Restoration Plan. At the same time, the board of directors amended the 401(k) Plan and the 401(k) Restoration Plan, effective AprilJanuary 1, 2013,2015, to provide eligibility to participate in the 2% employer core contributioncontri- bution to those employees who will no longer accrue benefits under the Pension Plan. The 2% employer core contribution has been in effect since 2005 when the Pension Plan was closed to new employees hired after December 31, 2004. For additional information, please see the narrative accompanying the “Pension Benefits as of December 31, 2013”2014” table on page 6564 and the narrative accompanying the “Nonqualified Deferred Compensation for 2013”2014” table on pages 65 to 66 and 67 of this proxy statement. Other Benefits Other benefits include: Nonqualified Deferred Incentive Savings Plan: | º | Provides a savings vehicle in a tax efficient manner |
| º | Provides certain executives the ability to voluntarily defer payouts of annual cash incentives, CIUs and base pay into a nonqualified deferred compensation plan |
Limited additional benefits, including, financial counseling to assist with tax law compliance and
| • | Effective February 2015, certain executives with RSUs and PSUs who are subject to the executive stock ownership policy, may voluntarily elect to defer settlement of RSUs and PSUs until termination or retirement. Executives who choose deferral receive dividend equivalents after the award vests which are also deferred. | | • | Limited additional benefits, including, financial counseling to assist with tax law compliance and to provide guidance in managing complex investment, tax, legal and estate matters; up to a maximum of $7,500 per year | | • | Relocation assistance for executives asked to move to a new work location facilitates the placement of the right person in the job and aids in developing talent | | • | Executive physical | | • | Spousal travel |
COMPENSATION DISCUSSION AND ANALYSIS to provide guidance in managing complex investment, tax, legal and estate matters; up to a maximum of $7,500 per year
Relocation assistance for executives asked to move to a new work location facilitates the place-
| | ment of the right person in the job and aids in developing talent | | | | | • | Executive physical | | | | | • | Spousal travel |
Process for Determining Named Executive Officer Compensation Committee The Committee is responsible for reviewing the performance of and approving compensation awarded to our executive officers, other than the CEO. The independent board members, with the input of the Committee, annually set the CEO’s individual target compensation, review his performance and determine his compensation payoutpay-out in the context of the established objectives, the actual the actual performance against those objectives and the TSR. In addition, the Committee, and the independent board members with respect to the CEO, may exercise negative discretion in its sole determination. The Committee works closely with its independent consultant, Pay Governance LLC, and management to examine various pay and performance matters throughout the year.
Independent Compensation Consultant The Committee hiredretains Pay Governance as its independent compensation consultant in June, 2012. The Committeeand considers advice and information from its independent compensation consultantprovided by Pay Governance in determining the compensation for the CEO and the other NEOs. The consultant regularly attends the Committee meetings and advises on a range of matters, including peer group composition, plan design, and plan design. The consultant regularly attends the Committee meetings.competitive pay practices. The consultant does not perform other services for the company. We incurred $145,396$46,077 in fees for Pay Governance for services performed for the Committee during 2013.2014. The Committee considered the following six factors and determined there was no conflict in the engagement of Pay Governance and that Pay Governance is independent: i)(i) the provision of other services to the company by Pay Governance; (ii) the amount of fees received from the company by Pay Governance, as a percentage of the total revenue of Pay Governance; (iii) the policies and procedures of Pay Governance that are designed to prevent conflicts of interest; (iv) any business or personal relationship of the Pay Governance consultant with a member of the Committee; (v) any company stock owned by the Pay Governance consultants; and (vi) any business or personal relationship of the Pay Governance consultant or Pay Governance with any of the company’s executive officers. The Committee has the sole authority to hire and terminate its consultant. The Committee reviews independence factors applicable to other consultants, including, outside law firms and Towers Watson, management’s compensation consultant.
COMPENSATION DISCUSSION AND ANALYSIS
Determining Compensation—The Decision Process 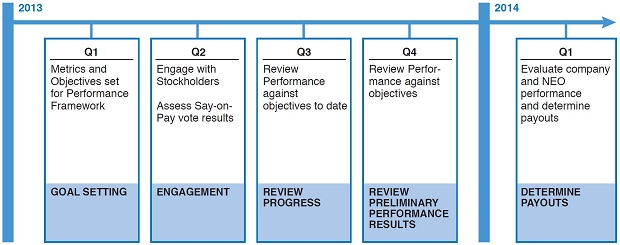 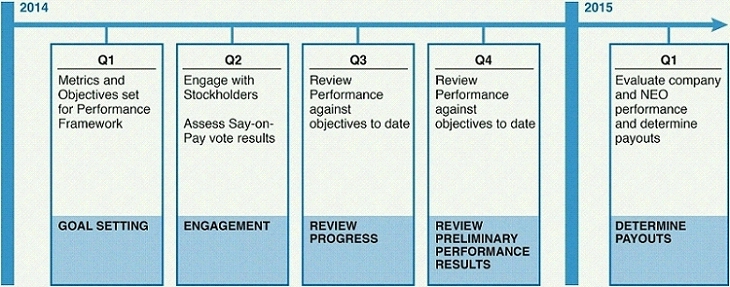
At the beginning of each year our CEO, on behalf of senior management, recommends to the Committee financial objectives for the annual and long-term incentive plans based on the financial objectives set by the board of directors. The Committee and the independent directors review the recommendations of management particularly with respect to the appropriateness and rigor of the objectives and approve the final annual and long term objectives. After reviewing benchmarking data presented by external consultants, our CEO and Executive Vice President and Chief Human Resources Officer recommend compensation target levels for total direct compensation as well as the annual and long-term incentive compensation for executive officers, including the NEOs, other than the CEO. The Committee reviews management’s recommendations and determines the appropriate financial objectives, base salary and the target levels of annual and long-term incentive compensation. The Committee also recommends for approval by the independent board members the CEO’s base salary and annual and long-term incentive target levels. Generally at this time,
COMPENSATION DISCUSSION AND ANALYSIS the Committee also approves any changes to the compensation program for the coming year. At the end of each year, each NEO completes a written self-assessment of his or her performance against his or her objectives. The CEO evaluates the performance of his executive officer direct reports and recommends incentive compensation actions other than for himself to the Committee. The Committee recommends to the independent board members an individual rating for the CEO. The Committee reviews the financial accomplishments of the company, taking into account predetermined objectives for the preceding year, and determines actual base salary increases as well as the annual and long-term incentive compensation for the NEOs and recommends for approval by the independent board members the CEO’s compensation. The actual payout levels for annual incentive compensation are based upon the com- pany’scompany’s performance against the predetermined financial objectives and other criteria, as discussed in further detail under “Annual Incentives” beginning on page 44.43. For long-term incentive compensation, the recommendation to the Committee for payout levels is based on pre-determined financial objectives and a TSR Modifier, as discussed in further detail under “Long-term Incentives” beginning on page 4645 of this proxy statement.
To assist in this process, the Committee also reviews tally sheets prepared by the Human Resources department preparesdepart- ment to evaluate the individual components and the total mix of compensation. The tally sheets show the dollar amount of each of the components of each executive officer’s compensation, summarizing the total compensation opportunity, including the executive’s fixed and variable compensation, perquisites and potential payments upon termination or Change of Control. In addition, the tally sheets include a summary of historical compensation. These tally sheets aid the Committee in analyzing the individual compensation components as well as the compensation mix and weighting of the components within the total compensation package. To evaluate whether each NEO’s compensation package is competitive with the marketplace, the Committee, and with respect to the CEO, the independent board members, also reviewsreview each executive’s total direct compensation against market data during the benchmarking process as more fully described in “Assessing Competitive Practice” below. Based on the structure of our current management team, the Committee and the board strive to ensure that the relationship between the compensation paid to the CEO and the second highest paid NEO are within acceptable market norms, subject to considerations such as performance, the market median compensation of the respective positions, contributions to the company and experience that may lead to deviations from market relationships.
COMPENSATION DISCUSSION AND ANALYSIS
Assessing Competitive Practice To evaluate whether Pitney Bowes’ executive compensation is competitive in the marketplace, the Committee annually compares each executive’s total direct compensation (base salary, annual incentive and long-term incentives) against two independent reports with a view towards determining the optimal mix and level of compensation, the Towers Watson Regressed Compensation Report (Towers Watson Report), and the Radford High-Tech Industry Survey Report (Radford Report). We then review the targets and actual payouts against publicly available data from our peer group to evaluate ongoing compensation opportunity and competitiveness. Finally, the Committee’s independent compensation consultant reviews the data presented to the Committee, before the Committee establishes the target total direct compensation structure. The Committee sets compensation targets on the assumption thatassuming achievement of specific incentive award performance objectives are achieved at their target level. target. The Towers Watson data is regressed for corporate revenue of approximately $4.0 billion for corporate leaders and actual regressed revenue for business unit leaders. The Towers Watson Report is a sub-section of the 2014 US Compensation Data Bank (CDB) General Industry Executive Database. The Radford Report bases its analysis on applicable revenue ranges as they pertain to various roles. The Radford Report is derived from a database of survey results from high-tech companies. The Committee believes using the Towers Watson Report regressed revenue scope and the revenue ranges in the Radford Report more accurately reflect market competitiveness against outside companies. However, the exact number of companies included in the data for each executive position may vary depending on the structure of the applicable company and whether the company submitted the relevant data. The Towers Watson Report is a sub-section of the 2013 US CDB General Industry Executive Database. The Radford Report is derived from a database of survey results from high-tech companies. This market data provides important reference points for the Committee but is not the sole basis for determining appropriate compensation design, compensation targets, or individual pay levels. Use of comparative industry data and outside surveys only serves to indicate to the Committee whether those decisions are in line with industry in general and our peer group in particular. The Committee believes that the comparative industry data used from the Towers Watson Report, the Radford Report and the peer group are consistent with our compensation philosophy. In addition, compensation targets and individual pay levels may vary from the median for various reasons, including: | | • | the value of the total rewards package; | | | | | | • | program design and strategic considerations; | | | | | | • | affordability; | | | | | | • | changing competitive conditions; | | | | | | • | program transition considerations; | | | | | | • | the definition and scope of the executive’s role; | | | | | | • | the executive’s individual contributions to the company; or | | | | | | • | succession or retention considerations. |
COMPENSATION DISCUSSION AND ANALYSIS In making its determination that the Pitney Bowes compensation package is appropriate and competitive, the Committee takes the following actions. The Committee first referencesidentifies for each NEO the median of the data presented in the Towers Watson and Radford Reports in determining target base salary, target total cash compensation and target total direct compensation. However, inIn making its final determination on any one position, the Committee will also take into account unique skill sets presented by the employee in high-growth areas targeted by the company.employee. In addition, as a supplement to the Towers Watson and Radford information,Reports, the Committee asks Pay Governance to perform its analysis and provide its opinion on the specific compensation program design. The Committee and the board also consider the burn rate with respect to the equity awards when deciding how much of the total direct compensation package should be composed of equity-based awards. Burn rate is the total equity awarded in a fiscal year divided by the total common stock outstanding at the beginning of the year. Our three-year average burn rate of 1.00% for the time period from 20112012 to 20132014 is 0.86% (down from 1.00% based on the prior year three-year average), and is well below the median burn rate of 1.72%1.60% for S&P 1500 companies in fiscal year 20122013 (source: Equilar 20132014 Equity Trends Report). Next, the Committee annually reviews our relative performance, compensation targets and actual payouts against the relative performance and compensation of the peer group listed below. Based on this rigorous review, the Committee has determined that the Pitney Bowes total compensation package for 20132014 is appropriate and competitive considering all the factors outlined above. PEER GROUP Although we do not have a single completely overlapping competitor due to the unique mix of our business, we use a peer group of companies similar in size and complexity to benchmark our executive compensation against.compensation. In 2013,2014, the Committee changedreviewed the composition of the peer group to reflect the sale of Pitney Bowes Management Services (PBMS) and the company’s enhanced focus on software and technology.decided that no changes were necessary. Pay Governance and the Committee designed our peer group so the Committee could analyze compensation packages, including compensation mix and other benefits, within the competitive market to attract and retain the talent and skill required to lead our business. This peer group consists of services, industrial and technology companies. When evaluating the appropriateness of the peer group, the Committee considered factors such as revenue, net income, market capitalization, number of employees, and complexity of the business to ensure a reasonable balance in terms of company size and an adequate number of peers. The Committee also considered any feedback received from stockholders. The newOur peer group consists of companies with revenues between $2.7 billion and $22.3$21.1 billion, and market capitalization between $1.5 billion and $16.4$18.3 billion.
COMPENSATION DISCUSSION AND ANALYSIS
Based upon these considerations, the Committee eliminated the following companies from the prior peer group:
| • | Agilent Technologies | | | | | • | Avery Dennison |
The Committee eliminated Agilent Technologies because of its primary focus on bioanalytical solutions, a business that does not closely reflect our portfolio. The Committee removed Avery Dennison to reflect our emphasized focus on technology and software following the sale of PBMS.
The Committee added the following companies to the peer group:
| • | EchoStar Corp. | | | | | • | Fidelity National Information Services, Inc. | | | | | • | The Western Union Co. |
The Committee added EchoStar Corp. since it is an appropriately-sized equipment manufacturing business, Fidelity National Information Services, Inc. because of its focus on data processing solutions and services, similar to the geocoding and address processing services we provide to our clients and the Western Union Co. because of its focus on financial transactions as well as data processing and outsourcing services, which are similar to our leasing, banking and processing services functions. The Committee decided to continue to include Xerox in our peer group despite the revenue size difference because the Committee considers it our closest direct peer in the office equipment space and it also is undergoing a similar transformation in its core business.
| | | | Peer Group | | | | | | | | | | | | | | | | | | | | | | | | | | | | | | | | | | Fiscal 2013 | | 12/31/2013 | | | | | | | | | | | | | | | | Revenue | | Market Capitalization | | Total Stockholder Return | | | Company Name | | ($ millions) | | ($ millions) | | 1-Year | | 3-Year | | 5-Year | | Alliance Data Systems Corporation | | | 4,150 | | | | 12,808 | | | | 82 | % | | | 55 | % | | | 41 | % | | Diebold, Incorporated | | | 2,886 | | | | 2,107 | | | | 12 | % | | | 5 | % | | | 7 | % | | DST Systems Inc. | | | 2,650 | | | | 3,827 | | | | 52 | % | | | 29 | % | | | 20 | % | | EchoStar Corp. | | | 3,261 | | | | 4,494 | | | | 45 | % | | | 26 | % | | | 27 | % | | Fidelity National Information Services, Inc. | | | 5,992 | | | | 15,628 | | | | 57 | % | | | 27 | % | | | 29 | % | | Fiserv, Inc. | | | 4,742 | | | | 15,231 | | | | 49 | % | | | 26 | % | | | 27 | % | | Harris Corporation | | | 5,042 | | | | 7,461 | | | | 47 | % | | | 19 | % | | | 17 | % | | Iron Mountain Inc. | | | 3,016 | | | | 5,803 | | | | 1 | % | | | 15 | % | | | 9 | % | | Lexmark International Inc. | | | 3,629 | | | | 2,206 | | | | 59 | % | | | 4 | % | | | 8 | % | | NCR Corp. | | | 6,095 | | | | 5,668 | | | | 34 | % | | | 30 | % | | | 19 | % | | R.R. Donnelley & Sons Company | | | 10,385 | | | | 3,686 | | | | 144 | % | | | 13 | % | | | 16 | % | | Rockwell Automation Inc. | | | 6,352 | | | | 16,401 | | | | 44 | % | | | 21 | % | | | 33 | % | | Unisys Corporation | | | 3,440 | | | | 1,474 | | | | 94 | % | | | 9 | % | | | 32 | % | | The Western Union Company | | | 5,545 | | | | 9,526 | | | | 31 | % | | | 0 | % | | | 6 | % | | Xerox Corporation | | | 22,282 | | | | 14,895 | | | | 83 | % | | | 4 | % | | | 11 | % | | | | | | | | | | | | | | | | | | | | | | | | 25th Percentile | | | 3,350 | | | | 3,756 | | | | 39 | % | | | 7 | % | | | 10 | % | | Median | | | 4,742 | | | | 5,803 | | | | 49 | % | | | 19 | % | | | 19 | % | | 75th Percentile | | | 6,044 | | | | 13,852 | | | | 71 | % | | | 27 | % | | | 28 | % | | | | | | | | | | | | | | | | | | | | | | | | Pitney Bowes Inc. | | | 4,843 | | | | 4,706 | | | | 132 | % | | | 7 | % | | | 6 | % | | PBI Percent Rank | | | 52 | % | | | 37 | % | | | 98 | % | | | 25 | % | | Lowest | | | Source: Capital I.Q. | | | | | | | | | | | | | | | | | | | | |
COMPENSATION DISCUSSION AND ANALYSIS Peer Group | Company Name | | Fiscal 2014
Revenue
($ millions) | | 12/31/2014
Market Capitalization
($ millions) | | 1-Year | | Total Stockholder Return
3-Year | | 5-Year | | | Alliance Data Systems Corporation | | $ | 4,958 | | | $ | 18,313 | | | | 9 | % | | | 40 | % | | | 35 | % | | | Diebold, Incorporated | | $ | 3,001 | | | $ | 2,239 | | | | 8 | % | | | 8 | % | | | 8 | % | | | DST Systems Inc. | | $ | 2,710 | | | $ | 3,583 | | | | 5 | % | | | 29 | % | | | 18 | % | | | EchoStar Corp. | | $ | 3,410 | | | $ | 4,811 | | | | 5 | % | | | 35 | % | | | 21 | % | | | Fidelity National Information Services, Inc. | | $ | 6,305 | | | $ | 17,649 | | | | 18 | % | | | 35 | % | | | 23 | % | | | Fiserv, Inc. | | $ | 5,013 | | | $ | 17,314 | | | | 20 | % | | | 34 | % | | | 24 | % | | | Harris Corporation | | $ | 4,976 | | | $ | 7,512 | | | | 5 | % | | | 29 | % | | | 11 | % | | | Iron Mountain Inc. | | $ | 3,109 | | | $ | 8,098 | | | | 49 | % | | | 21 | % | | | 20 | % | | | Lexmark International Inc. | | $ | 3,694 | | | $ | 2,530 | | | | 20 | % | | | 12 | % | | | 12 | % | | | NCR Corp. | | $ | 6,493 | | | $ | 4,907 | | | | –14 | % | | | 21 | % | | | 21 | % | | | Pitney Bowes Inc. | | $ | 3,822 | | | $ | 4,898 | | | | 8 | % | | | 17 | % | | | 8 | % | | | R.R. Donnelley & Sons Company | | $ | 11,289 | | | $ | 3,358 | | | | –12 | % | | | 14 | % | | | 1 | % | | | Rockwell Automation Inc. | | $ | 6,557 | | | $ | 15,083 | | | | –4 | % | | | 17 | % | | | 21 | % | | | Unisys Corporation | | $ | 3,447 | | | $ | 1,472 | | | | –12 | % | | | 14 | % | | | –5 | % | | | The Western Union Company | | $ | 5,619 | | | $ | 9,360 | | | | 7 | % | | | 2 | % | | | 1 | % | | | Xerox Corporation | | $ | 21,142 | | | $ | 15,678 | | | | 16 | % | | | 23 | % | | | 13 | % | | | | | | | | | | | | | | | | | | | | | | | | | | 25th Percentile | | | $3,428 | | | | $3,470 | | | | 3 | % | | | 14 | % | | | 8 | % | | | Median | | | $4,976 | | | | $7,512 | | | | 7 | % | | | 21 | % | | | 16 | % | | | 75th Percentile | | | $6,399 | | | $ | 15,381 | | | | 17 | % | | | 31 | % | | | 21 | % | | | | | | | | | | | | | | | | | | | | | | | | | | Pitney Bowes Inc. | | | $3,822 | | | | $4,898 | | | | 8 | % | | | 17 | % | | | 8 | % | | | PBI Percent Rank | | | 40% | | | | 40 | % | | | 53 | % | | | 33 | % | | | 27 | % | | | Source: Capital I.Q. | | | | | | | | | | | | | | | | | | | | | |
COMPENSATION DISCUSSION AND ANALYSIS Other Policies and Guidelines Clawback Policy The company’s executive compensation programs include a “clawback” feature, allowing the board of directors to adjust, recoup or require the forfeiture of any awards made or paid under any stock plan or the KEIPKey Employees Incentive Plan (KEIP) under the following circumstances: | | • | to any executive officer, including NEOs, in the event of any financial restatement due to a misrepresentation of the financial statements of the company. This applies to vesting or to payments made or paid during the 36-month period prior to the financial restatement; or | | | | | | • | to any employee, including NEOs, whom the board of directors reasonably believes engaged in gross misconduct or breached any provisions in their Proprietary Interest Protection Agreement, which generally provides for confidentiality, and non-competition and non-solicitation of employees and customers for one year following termination of employment. |
No Agreements with Executives We have not entered into fixed term employment agreements with any of our NEOs, including the CEO. Therefore, such officers are “at will” employees. No Pledging, Hedging and Other Short-term Speculative Trading We have policies prohibiting both the pledging and hedging of our stock. Neither the board of directors nor management-level employees may pledge or transfer for value Pitney Bowes securities, engage in short-term speculative (“in and out”) trading in Pitney Bowes securities, or participate in hedging and other derivative transactions, including short sales, “put” or “call” options, swaps, collars or similar derivative transactions, with respect to Pitney Bowes securities (other than transactions in employee stock options). Executive Stock Ownership Policy We maintain an executive stock ownership policy that encourages executives to think as owners and to own substantial amounts of company stock to more closely align our key executives’ interests with the long-term interests of our stockholders. In 2013, theThe Committee once again reviewedreviews the executive stock ownership policy using external benchmarks. Althoughannually to make sure it is in line with the benchmarks indicated thatpolicy’s objectives.
Under the priorexecutive stock ownership policy was predominantly in line with market best practices, the Committee made changes to the company’s executive stock ownership policy. The Committee adopted the changes to further emphasize its expectation that its executives think like owners, own substantial amounts of company stock and more closely align their interests with long-term stockholders. Although the multiple of base salary ownership requirement for the CEO and other executive officers will remain atis 5X and 2X, respectively, unvested RSUrespectively. Unit presidents and option awards willstaff vice presidents are required to own 1X multiple of base salary. The policy was amended in 2014 to no longer count toward the ownership requirement. Instead, onlyunvested RSUs, MSUs, PSUs and all option awards. Only shares owned outright, shares held in a trust and shares owned inunder a deferred compensation plan will bearrangement are counted toward the ownership requirement. In addition,
Beginning with RSU and PSU awards made in February 2015, executives who are required to own certain levels of company stock under the Committee approved expandingexecutive stock ownership policy may elect to defer the policysettlement of RSUs and PSUs upon vesting until the executives terminate employment or retire. Executives who choose to include unit presidents and staff vice presidents at a 1X multiple of base salary.defer in this manner receive dividend equivalents once the awards vest, which are also deferred as vested RSUs. | Title | Stock Ownership as a
Multiple of Base Salary | | Chief Executive Officer | 5X | | Other Executive Officers | 2X | | Unit Presidents and Staff Vice | | | Presidents | 1X |
We calculate the number of shares targeted for retention by multiplying an executive’s annual base salary times the multiple of salary required and dividing by the average closing price of our common stock on the last trading day of each of the prior two calendar years. The guidelines provide that the CEO and other executive officers have five years to achieve the required ownership levels from the date of the first award following the time they become covered by this policy. policy or covered by an increased holding requirement. Until the CEO and other executive officers meet the required ownership levels, that executive is required to hold at least 75% of their “net profit shares” in the first five years, and 100% of the “net profit shares” thereafter. Unit Presidents and Staff Vice Presidents must hold at least 50% of their “net profit shares” until the multiple is met. Net profit shares are, withWith respect to stock options, net profit shares are the shares remaining after payment of the option exercise price and taxes owed upon exerciseis exercised, and, with respect to vested performance-based RSUs, PSUs and restricted stock, net profit shares are the shares that remainremaining after thevesting and payment of applicable taxes. As long as the multiple of salary requirement is met, an executive may sell shares acquired previously in the market as well as shares acquired through the exercise of stock options or the vesting of equity awards.awards, subject to normal trading restrictions. The company’s Stock Plan of 2013 allows executives subject to the stock ownership policy to defer settlement of RSUs and PSUs after vesting so that executives may achieve required ownership levels faster.
COMPENSATION DISCUSSION AND ANALYSIS Change of Control We believe that the cash payments and benefit levels provided to our executives following a Change of Control transaction are consistent with current market practice for companies of our size. Our Change of Control arrangements are intended to encourage those executives most closely connected to a potential Change of Control to act more objectively, and therefore, in the best interests of our stockholders, despite the fact that such a transaction could result in the executives’ termination. Our Change of Control protections also encourage executives to remain with the company until the completion of the transaction to enable a successful transition. Except for equity awards made under our now superseded 2002 Stock Plan, acceleratedAccelerated vesting of equity awards and Change of Control severance payments occur only when an employee is terminated without cause or when an employee voluntarily terminates for good reason (such as a reduction in position, pay or other constructive termination event) within two years following a Change of Control (a “double trigger” payment mechanism). The Change of Control, by itself, does not cause severance payments or accelerated vesting of equity awards except for those under the 2002 Stock Plan.awards. In 2012, the board eliminated theThe company does not gross up its executives for any excise tax gross-up provision of the policy which previously allowed the reimbursement of any excise taxes imposed by Section 4999 of the IRC in the event that 110% of the safe-harbor amount was exceeded.
In February 2013, based on competitive data and stockholder feedback and continuing our practice of exercising good pay governance, the board amended the Change of Control benefit payable to the executive offi-payments.
cers, including NEOs, underUnder the Senior Executive Severance Policy (SESP), NEOs are entitled to severance equal to two times the
sum of the participant’s current annual salary and the participant’s average annual incentive award in the preceding three calendar years fromin the prior three timesevent their employment is terminated on account of annual salary and incentive award. During Mr. Lautenbach’s first 18 months of employment, if a Change of Control were to occur, he would receive severance benefits under the SESP equal to (a) 1.5 times his then current base salary and (b) 1.5 times his then current target bonus, payable in a lump sum. All other severance benefits under the SESP are the same as other senior executives covered by the policy.period.
The board of directors also approved a change in the definition ofA Change of Control dealing with the acquisition of company shares. Under the new definition, a Change of Control would occur if there is defined as (i) an acquisition of 30% (previously 20%) or more of our common stock, or 30% (previously 20%) or more of the combined voting power of our voting securities by an individual, entity or group.group, (ii) replacement of a majority of the board of directors other than as approved by the incumbent board, (iii) as a result of a reorganization, merger, consolidation or sale, more than 50% of our common stock and voting power changes hands, or (iv) approval by stockholders of a liquidation or dissolution of the company.
Our Change of Control arrangements fit into our overall compensation objectives because they are aligned with our goal of providing a compensation package sufficiently competitive to attract and retain talent and aligned with stockholder interests. With the prior adoption of the double trigger payment mechanism applicable to both equity vesting and cash payouts and the more recent eliminationlack of theany gross-up, provision, we believe the Change of Control arrangements are market leading from a corporate governance perspective.
Tax and Accounting Our compensation programs are generally designed with the intent to satisfy the requirements for full deductibility under IRC Section 162(m) of the Code.. IRC Section 162(m) denies the company a tax deduction for certain compensation in excess of $1 million paid to “covered employees” unless the compensation is qualified performance-based compensation. We generally structure our incentive compensation programs with the intention to be IRC 162(m) compliant. However, the Committee weighs the benefits of compliance with IRC Section 162(m) against the potential limitations of such compliance, and may award compensation that may not be fully deductible if it determines that it is in the company’s best interest to do so. The rules and regulations promulgated under IRC 162(m) are complicated and subject to change from time to time, sometimes with retroactive effect. In addition, a number of requirements must be met in order for particular compensation to qualify. As such, there can be no assurance that any compensation awarded or paid by the company will be fully deductible under all circumstances. Stock options are not currently granted as part of the mix of long-term incentives, however, special awards of stock options may be granted. In those cases we value stock options based upon the Black-Scholes valuation method, consistent with the provisions of FASB Accounting Standards Codification Topic 718 (ASC 718). Key assumptions used to estimate the fair value of stock options include: | | • | the volatility of our stock price; | | | | | | • | the risk-free interest rate; | | | | | | • | expected term; and | | | | | | • | our dividend yield. |
We value MSUs based uponalso use a Monte-Carlo Simulationsimulation, which is a generally accepted statistical technique, used, in this instance, to simulatevalue MSUs and PSUs. The technique simulates a range of possible future stock prices for the company. Key assumptions used to estimate the value of MSUs unitsand PSUs include: | | • | the volatility of our stock price; | | | | | | • | the risk-free interest rate; | | | | | | • | expected term; and | | | | | | • | our dividend yield. |
The Monte-Carlo simulation uses generally the same metrics as Black-Scholes, but calculates its ultimate result using an iterative method that generates many possible future stock price paths. We believe that the valuation techniques and the approaches utilized to develop the underlying assumptions
COMPENSATION DISCUSSION AND ANALYSIS
are appropriate in estimating the fair value of our stock option, PSU and MSU grants. Estimates of fair value are not intended to predict actual future events or the value ultimately realized by employees who receive equity awards, and subsequent events are not indicative of the reasonableness of the original estimates of fair value made by the company under ASC 718. In determining the number of PSUs to be awarded in the mix of long-term incentives, we value PSUs based upon the Monte-Carlo simulated value on the date of grant. In reporting the value of PSU grants in the Summary Compensation Table, the value of PSUs shown represents the full value of the award based on a targeted number of shares multiplied by the Monte-Carlo value on the date of the award. The Monte-Carlo value also takes into
COMPENSATION DISCUSSION AND ANALYSIS account the non-payment of dividends during the vesting period. In determining the number of RSUs to be awarded in the mix of long-term incentives, we value RSUs based upon the closing price of our common stock on the grant date. In reporting the value of RSUs in the Summary Compensation Table, we discount the value of the RSUs for non-payment of dividends during the vesting period as required by accounting guidance under ASC 718. For additional information on the accounting treatment for stock-based awards, see note 1220 to the financial statements included in our Annual Report on Form 10-K for the year ended December 31, 2013.2014.
Treatment of Special Events In determining performance goals and evaluating enterprise performance results, the Committee may use its discretion and judgment to ensure that management’s rewards for business performance are commensurate with their contributions to that performance while still holding management accountable for the overall results of the business. The Committee believes that the metrics for incentive compensation plans should be specific and objective. However, in exercising its negative discretion, the Committee recognizes that interpretation of the application of pre-determined metrics to results may be necessary from time to time to better reflect the operating performance of the company’s business segments and take into account certain one-time events. In adopting its philosophy in establishing metrics and compensating the management team for its actual performance, the Committee believes it to be a fairer measure to remove the impact of certain events that may distort, either positively or negatively, the actual performance of management. The chart below explains the types of events that the Committee has taken into consideration in this regard. ACCOUNTING ITEMS AND RECONCILIATION OF GAAP TO NON-GAAP MEASURESNon-GAAP Measures
For 2013, the Committee determined that Adjusted earnings per share, Adjusted free cash flow, Adjusted income from continuing operations, and Adjusted earnings before interest and taxes may exclude the impact of certain special events (both positive and negative) such as restructuring charges, legal settlements and asset impairments, which materially impact the comparability of the company’s results.
The following are non-GAAP measures: Adjusted earnings per share, Adjusted free cash flow, Adjusted income from continuing operations, Adjusted earnings before interest and taxes and revenue growth.
| • | Adjusted earnings per share excludes special items (as discussed above under “Treatment of Special Events”) including the impact of any accounting changes. | | | | | • | Adjusted free cash flow is cash from operations less capital expenditures, adjusted for the cash impact of special events (as discussed above under “Treatment of Special Events”). | | | | | • | Adjusted income from continuing operations excludes special events (as described under “Treatment of Special Events”) including the impact of any accounting changes. | | | | | • | Adjusted earnings before interest and taxes excludes the impact of one-time adjustments, including restructuring charges, strategic actions, capital-related initiatives, and accounting changes. | | | | | • | Revenue growth is computed as the year over year change in revenue excluding the impact of foreign currency translation. |
This adjusted financial informationNon-GAAP measures should not be construed as an alternative to our reported results determined in accordance with Generally Accepted Accounting Principles or GAAP.(GAAP). Further, our definitiondefinitions of this adjusted financial informationthese non-GAAP measures may differ from similarly titled measures used by other companies. We use measures such as Adjustedadjusted earnings per share, Adjusted free cash flow, Adjustedadjusted income from continuing operations and Adjustedadjusted earnings before interest and taxes to exclude the impact of special items like restructuring charges, asset impairments and tax adjustments, and asset impairments, because, while these are actual income or expenses of ours, they can mask underlying trends associated with our business. Such items are often inconsistent in amount and frequency and, as such, the adjustments allow a stockholder greater insight into the current underlying operating trends of the business. The use
Adjusted earnings per share and adjusted income from continuing operations provide greater insight into the current underlying operating trends of Adjusted freethe business by excluding special items such as restructuring charges, asset impairments and tax adjustments. Free cash flow provides investors insight into the amount of cash that management could have available for other discretionary uses. It adjusts GAAP cash from operationsflow provided by operating activities for capital expenditures, as well as the cash impact of special items like cash used forsuch as restructuring charges, unusual tax settlements or payments and contributionsspecial pension contributions. Management uses earnings before interest and taxes (EBIT) to its pension funds.measure profitability and performance. EBIT is determined by deducting from revenue the related costs and expenses attributable to the segment. EBIT excludes interest and taxes, as well as special items such as restructuring charges and goodwill and asset impairments. Revenue growth is presented on a constant currency basis and excludes the impact of disposals of certain business operations. Revenue growth is intended to provide a better understanding of the underlying operational performance of the business over the period. COMPENSATION DISCUSSION AND ANALYSIS Pitney Bowes Inc. Reconciliation of Reported Consolidated Results to Adjusted Measures for Compensation
(Unaudited) | (Dollars in thousands, except per share data) | | | 2013 | | | | 2012(1) | | | | 2011(1) | | | | 2014 | | | | 2013(1) | | | | 2012(1) | | | GAAP diluted earnings per share from continuing operations, as reported | | $ | 1.49 | | | $ | 1.96 | | | $ | 2.16 | | | $ | 1.47 | | | $ | 1.42 | | | $ | 1.88 | | | Restructuring charges and asset impairments | | | 0.29 | | | | 0.06 | | | | 0.44 | | | | 0.29 | | | | 0.29 | | | | 0.06 | | | Extinguishment of debt | | | 0.10 | | | | — | | | | — | | | | 0.19 | | | | 0.10 | | | | — | | | Investment divestiture | | | | (0.05 | ) | | | — | | | | — | | | Sale of leveraged lease assets | | | — | | | | (0.06 | ) | | | (0.13 | ) | | | — | | | | — | | | | (0.06 | ) | | Tax adjustments | | | — | | | | — | | | | 0.02 | | | | Diluted earnings per share from continuing operations, as adjusted(2) | | $ | 1.88 | | | $ | 1.96 | | | $ | 2.49 | | | | Adjustment for discontinued operations(3) | | | — | | | | 0.20 | | | | 0.21 | | | | Adjusted diluted earnings per share(2) | | | 1.88 | | | | 2.16 | | | | 2.70 | | | | Diluted earnings per share from continuing operations(2) | | | | 1.90 | | | | 1.81 | | | | 1.88 | | | Adjustment for businesses sold(1) | | | | — | | | | 0.07 | | | | 0.28 | | | Investment divestiture | | | | 0.05 | | | | — | | | | — | | | Adjusted earnings per share(2) | | | $ | 1.95 | | | $ | 1.88 | | | $ | 2.16 | | | GAAP net cash provided by operating activities, as reported | | $ | 624,824 | | | $ | 660,188 | | | $ | 948,987 | | | $ | 655,526 | | | $ | 624,824 | | | $ | 660,188 | | | Capital expenditures | | | (137,512 | ) | | | (176,586 | ) | | | (155,980 | ) | | | (180,556 | ) | | | (137,512 | ) | | | (176,586 | ) | | Reserve account deposits | | | | (15,666 | ) | | | (20,104 | ) | | | 1,636 | | | Restructuring payments | | | 59,520 | | | | 74,718 | | | | 107,002 | | | | 56,162 | | | | 59,520 | | | | 74,718 | | | Extinguishment of debt | | | | 61,657 | | | | 32,639 | | | | — | | | Net receipts related to investment divestiture | | | | (5,737 | ) | | | — | | | | — | | | Tax and other payments on sale of businesses and leveraged lease assets | | | | — | | | | 75,545 | | | | 114,128 | | | Pension contribution | | | — | | | | 95,000 | | | | 123,000 | | | | — | | | | — | | | | 95,000 | | | Tax and other payments on sale of businesses and leveraged lease assets | | | 75,545 | | | | 114,128 | | | | — | | | | Free cash flow | | | | 571,386 | | | | 634,912 | | | | 769,084 | | | Reserve account deposits | | | (20,104 | ) | | | 1,636 | | | | 35,354 | | | | 15,666 | | | | 20,104 | | | | (1,636 | ) | | Extinguishment of debt | | | 32,639 | | | | — | | | | — | | | | Free cash flow, as adjusted | | | 634,912 | | | | 769,084 | | | | 1,058,363 | | | | Reserve account deposits | | | 20,104 | | | | (1,636 | ) | | | (35,354 | ) | | | Reclassification(4) | | | — | | | | — | | | | (28,794 | ) | | | Net finance receivables(3) | | | | (119,668 | ) | | | — | | | | — | | | Adjusted free cash flow | | $ | 655,016 | | | $ | 767,448 | | | $ | 994,215 | | | $ | 467,384 | | | $ | 655,016 | | | $ | 767,448 | | | GAAP income from continuing operations after income taxes, as reported | | $ | 301,733 | | | $ | 395,684 | | | $ | 437,593 | | | $ | 300,006 | | | $ | 287,612 | | | $ | 379,107 | | | Restructuring charges and asset impairments, after tax | | | 59,024 | | | | 11,610 | | | | 89,477 | | | | 59,349 | | | | 59,024 | | | | 11,610 | | | Extinguishment of debt, after tax | | | 19,911 | | | | — | | | | — | | | | Extinguishment of debt, after tax. | | | | 37,833 | | | | 19,911 | | | | — | | | Investment divestiture, after tax. | | | | (9,774 | ) | | | — | | | | — | | | Sale of leveraged lease assets, after tax | | | — | | | | (12,886 | ) | | | (26,689 | ) | | | — | | | | — | | | | (12,886 | ) | | Tax adjustments | | | — | | | | — | | | | 3,539 | | | | Adjusted income from continuing operations | | $ | 380,668 | | | $ | 394,408 | | | $ | 503,920 | | | | Income from continuing operations, as adjusted | | | | 387,414 | | | | 366,547 | | | | 377,831 | | | Adjustment for businesses sold(1) | | | | — | | | | 14,121 | | | | 57,446 | | | Adjusted income from continuing operations. | | | $ | 387,414 | | | $ | 380,668 | | | $ | 435,277 | | | GAAP income from continuing operations before income taxes, as reported | | $ | 403,177 | | | $ | 534,312 | | | $ | 491,486 | | | $ | 431,196 | | | $ | 383,954 | | | $ | 511,770 | | | Interest expense, net, before tax | | | 190,364 | | | | 188,386 | | | | 197,266 | | | | 169,450 | | | | 186,987 | | | | 184,675 | | | Restructuring charges and asset impairments, before tax | | | 84,344 | | | | 17,176 | | | | 118,630 | | | | Restructuring charges and asset impairments, before tax. | | | | 84,560 | | | | 84,344 | | | | 17,176 | | | Extinguishment of debt, before tax | | | 32,639 | | | | — | | | | — | | | | 61,657 | | | | 32,639 | | | | — | | | Sale of leveraged lease, before tax | | | — | | | | 3,817 | | | | 7,283 | | | | Earnings before interest and taxes, as adjusted | | $ | 710,524 | | | $ | 743,691 | | | $ | 814,665 | | | | Impacts of foreign currency compared to budget(5) | | | 3,210 | | | | — | | | | — | | | | Adjusted earnings before interest and taxes | | $ | 713,734 | | | $ | 743,691 | | | $ | 814,665 | | | | Investment divestiture, before tax | | | | (15,919 | ) | | | — | | | | — | | | Sale of leveraged lease assets, before tax | | | | — | | | | — | | | | 3,817 | | | Earnings before interest and taxes | | | | 730,944 | | | | 687,924 | | | | 717,438 | | | Impacts of foreign currency compared to budget(4) | | | | 417 | | | | 3,210 | | | | — | | | Adjustment for businesses sold(1) | | | | — | | | | 22,600 | | | | 26,253 | | | Adjusted earnings before interest and taxes. | | | $ | 731,361 | | | $ | 713,734 | | | $ | 743,691 | | | Reported revenue growth | | | (1.2% | ) | | | (5.1% | ) | | | (3.2% | ) | | | 0.8% | | | | (0.8% | ) | | | (5.1% | ) | | Impacts of foreign currency | | | 0.4% | | | | 1.1% | | | | (1.6% | ) | | | 0.4% | | | | 0.3% | | | | 1.1% | | | Revenue growth on a constant currency basis | | | (0.8% | ) | | | (4.0% | ) | | | (4.8% | ) | | | Disposal of certain business operations(5) | | | | 0.4% | | | | 0.0% | | | | 0.0% | | | Revenue growth. | | | | 1.6% | | | | (0.5% | ) | | | (4.0% | ) | | Adjustment for businesses sold(1) | | | | 0.0% | | | | (0.3% | ) | | | 0.6% | | | Adjusted revenue growth | | | | 1.6% | | | | (0.8% | ) | | | (3.4% | ) |
| (1) | 2013 and 2012 have been restated for discontinued operations that occurred subsequent to the reported fiscal year. During 2014, we sold our Canadian Document Imaging Solutions business. During 2013, we sold our PBMSPitney Bowes Management Services operations, our Nordic furniture business and our International Mail Services operations. The historical results for 2012 and 2011 have been restated to reflect the divested businesses as discontinued operations. | | | | | (2) | The sum of the earnings per share amounts may not equal the totals above due to rounding. | | | | | (3) | Represents amounts reclassified to discontinued operations related to transactions that occurredAdjusted free cash flow excludes the impact of finance receivables in 2013 and 2012.2014. | | | | | (4) | GAAP net cash provided by operating activities, as reported increased by $28.8 million for the year ended December 31, 2011 due to a reclassification between net cash provided by operating activitiesFor 2014 and net cash used in investing activities.2013, adjusted earnings before interest and taxes is translated at 2014 and 2013 budget rates, respectively. | | | | | (5) | For 2013, Adjusted earnings before taxes is translated at 2013 budget rates.revenue growth excludes the impact of the disposal of certain business operations in 2014. |
Executive Compensation Tables and Related Narrative The following “Summary Compensation Table” shows all compensation earned by or paid to for Messrs. Lautenbach, Monahan, Wright,Shearer, Goldstein, and Ms. Kohnstamm. Mmes. Abi-Karam and O’Meara terminated employment in 2013 but are included in the table below because they were executive officers during the course of the year with total compensation that would have placed them in the top five highest paid notwithstanding their termination of employment. The compensation shown below was paid for services performed during or with respect to 2014, 2013, 2012 and 2011.2012. The “Summary Compensation Table” includes amounts earned and deferred during the periods covered under the Deferred Incentive Savings Plan. The “Grants of Plan-Based Awards in 2013”2014” table on page 59 provides additional information regarding grants made during 20132014 to the NEOs. The “Stock Awards” and “Total” columns in the Summary Compensation Table (SCT) appear greater than historical amounts because of the company’s decision in 2014 to make its long-term incentive (LTI) plan 100% equity based. Last February, the Committee replaced cash incentive units (CIUs), payable in cash, with performance stock units (PSUs), settled in common stock. The new structure consists of 70% PSUs and 30% performance-based restricted stock units. Stock awards are reported in the SCT when granted, while cash awards are reported in the SCT under “Non-Equity Incentive Compensation” when paid. This creates a “bunching effect” making it appear as though the 2014 Stock Award and Total Amounts has comparatively increased from prior years, while in fact it only reflects the disparate manner in which equity and cash is required to be reported. This effect will continue through 2016 when all outstanding CIUs will be fully paid. See discussion on “bunching” in “Cash Incentive Units” on page 45 for additional details. SUMMARY COMPENSATION TABLE | Name and Principal Position | | Year | | Salary
($) | | Bonus
($)(1) | | Stock
Awards
($)(2) | | Option
Awards
($)(3) | | Non-Equity
Incentive
Plan
Compensation
($)(4) | | Change in
Pension Value
and
Nonqualified
Deferred
Compensation
Earnings
($)(5) | | All Other
Compensation
($)(6), (7) | | Total ($) | Marc B. Lautenbach
President and Chief
Executive Officer | | | | | | | | | | | | | | | | | | | | | 2013 | | 850,000 | | — | | 1,172,558 | | 148,800 | | 1,209,975 | | — | | 14,704 | | 3,396,037 | | | 2012 | | 70,833 | | — | | — | | 289,300 | | — | | — | | — | | 360,133 | | | | | | | | | | | | | | | | | | | | Michael Monahan
Executive Vice President
and Chief Financial Officer | | 2013 | | 578,400 | | — | | 381,082 | | 554,560 | | 1,481,678 | | 199,451 | | 42,940 | | 3,238,111 | | | 2012 | | 575,600 | | — | | 582,644 | | — | | 1,840,141 | | 161,052 | | 26,164 | | 3,185,601 | | | 2011 | | 558,000 | | — | | 279,737 | | 325,000 | | 1,135,294 | | 264,368 | | 53,534 | | 2,615,933 | | | | | | | | | | | | | | | | | | | | | Abby F. Kohnstamm
Executive Vice President
and Chief Marketing Officer | | | | | | | | | | | | | | | | | | | | | 2013 | | 303,333 | | 400,000 | | 379,947 | | — | | 264,768 | | — | | 200,240 | | 1,548,288 | | | | | | | | | | | | | | | | | | | | | | | | | | | | | | | | | | | | | | | | Mark F. Wright
Executive Vice President
and President, Pitney Bowes
Digital Commerce Solutions | | | | | | | | | | | | | | | | | | | | | | | | | | | | | | | | | | | | | | | | 2013 | | 356,061 | | 350,000 | | 450,421 | | — | | 328,500 | | — | | 4,961 | | 1,489,943 | | | | | | | | | | | | | | | | | | | | | | | | | | | | | | | | | | | | | | | | | | | | | | | | | | | | | | | | | | | Daniel J. Goldstein
Executive Vice President
and Chief Legal &
Compliance Officer | | | | | | | | | | | | | | | | | | | | | | | | | | | | | | | | | | | | | | | | 2013 | | 477,400 | | — | | 190,546 | | — | | 726,152 | | — | | 55,282 | | 1,449,380 | | | | | | | | | | | | | | | | | | | | | | | | | | | | | | | | | | | | | | | Leslie Abi-Karam(8)
former Executive Vice
President and President,
Pitney Bowes
Communications Solutions | | | | | | | | | | | | | | | | | | | | | 2013 | | 407,285 | | — | | 381,082 | | — | | 1,966,667 | | 789,701 | | 610,184 | | 4,154,919 | | | 2012 | | 553,800 | | — | | 582,644 | | — | | 728,365 | | 136,738 | | 44,707 | | 2,046,254 | | | 2011 | | 544,016 | | — | | 279,737 | | 325,000 | | 1,122,907 | | 328,795 | | 27,360 | | 2,627,815 | | | | | | | | | | | | | | | | | | | | | | | | | | | | | | | | | | | | | | | | Vicki A. O’Meara(9)
former Executive Vice
President and President,
Pitney Bowes Services
Solutions | | | | | | | | | | | | | | | | | | | | | 2013 | | 393,000 | | — | | 263,829 | | — | | 1,618,750 | | — | | 33,597 | | 2,309,176 | | | 2012 | | 522,500 | | — | | 403,367 | | — | | 508,788 | | — | | 47,782 | | 1,482,437 | | | 2011 | | 512,500 | | — | | 193,680 | | 225,000 | | 787,010 | | — | | 38,444 | | 1,756,634 | | | | | | | | | | | | | | | | | | | |
| Name and Principal Position | | Year | | Salary
($) | | Bonus
($)(1) | | Stock
Awards
($)(2) | | Option
Awards
($)(3) | | Non-Equity
Incentive
Plan
Compensation
($)(4) | | Change in
Pension Value
and
Nonqualified
Deferred
Compensation
Earnings
($)(5) | | All Other
Compensation
($)(6),(7) | | Total ($) | | Marc B. Lautenbach | | 2014 | | 891,667 | | — | | | 4,420,297 | | — | | | 1,519,965 | | | — | | | 134,431 | | | 6,966,360 | | President and Chief | | 2013 | | 850,000 | | — | | | 1,172,558 | | 148,800 | | | 1,209,975 | | | — | | | 14,704 | | | 3,396,037 | | Executive Officer | | 2012 | | 70,833 | | — | | | — | | 289,300 | | | — | | | — | | | — | | | 360,133 | | Michael Monahan(8) | | 2014 | | 602,500 | | — | | | 1,276,978 | | — | | | 1,472,306 | | | 162,214 | | | 30,761 | | | 3,544,759 | | Executive Vice President | | 2013 | | 578,400 | | — | | | 381,082 | | 554,560 | | | 1,481,678 | | | 199,451 | | | 42,940 | | | 3,238,111 | | and Chief Financial Officer | | 2012 | | 575,600 | | — | | | 582,644 | | — | | | 1,840,141 | | | 161,052 | | | 26,164 | | | 3,185,601 | | Mark L. Shearer | | 2014 | | 568,875 | | — | | | 1,276,978 | | — | | | 572,107 | | | — | | | 33,593 | | | 2,451,553 | | Executive Vice President | | | | | | | | | | | | | | | | | | | | | | | | | and President, Pitney Bowes | | | | | | | | | | | | | | | | | | | | | | | | | SMB Mailing Solutions | | | | | | | | | | | | | | | | | | | | | | | | | Abby F. Kohnstamm | | 2014 | | 560,000 | | 400,000 | | | 879,173 | | — | | | 560,448 | | | — | | | 15,289 | | | 2,414,910 | | Executive Vice President | | 2013 | | 303,333 | | 400,000 | | | 379,947 | | — | | | 264,768 | | | — | | | 200,240 | | | 1,548,288 | | and Chief Marketing Officer | | | | | | | | | | | | | | | | | | | | | | | | | Daniel J. Goldstein | | 2014 | | 489,335 | | — | | | 638,476 | | — | | | 801,337 | | | 40,038 | | | 34,014 | | | 2,003,200 | | Executive Vice President | | 2013 | | 477,400 | | — | | | 190,546 | | — | | | 726,152 | | | — | | | 55,282 | | | 1,449,380 | | and Chief Legal & | | | | | | | | | | | | | | | | | | | | | | | | | Compliance Officer | | | | | | | | | | | | | | | | | | | | | | | |
| (1) | On JulyJune 15, 2013,2014, Ms. Kohnstamm was awarded a $400,000the second half of her cash sign-on award uponin the amount of $400,000, in connection with her hire. On May 15, 2013, Mr. Wright was awarded a $350,000 cash sign-on award upon his hire. In both cases, the sign on bonuses will be forfeited if employment does not continue beyond the first year anniversary of the date of hire.hiring as Executive Vice President and Chief Marketing Officer in 2013. | | | | | (2) | This column includes the value of stock awarded to NEOs during 2014, 2013 2012 and 20112012 based upon its grant date fair value, as determined in accordance with the share-based payment accounting guidance under ASC 718. Performance-basedSEC guidance. Performance stock units (PSUs) and performance-based RSUs were granted to the NEOs in 2013.2014. Details regarding the grants of PSUs and performance-based RSUs can be found in the “Grants of Plan-Based Awards in 2013”2014” table and details regarding outstanding stock awards can be found in the “Outstanding Equity Awards at 20132014 Fiscal Year-End” table. For Mr. MonahanSee page 47 in “Compensation Discussion and Mmes. Abi-KaramAnalysis” for additional information on RSUs and O’Meara, stock awarded in 2012 and 2011 was previously disclosedPSUs. The value of PSUs shown represents the full value of the award based upon its granton a targeted number of shares multiplied by the Monte-Carlo value on the date market value and is restated to reflectof the grant date fair value. Grant date fair value is the appropriate valuation of an RSU that does not pay dividends to the executive during the vesting period.award. If performance conditions allow for MSUsPSUs granted in 20122014 to reach the 200% maximum number of shares, based on the Monte-Carlo simulated grant date fair value, the total value of stock awarded in 20122014 inclusive of RSUs and PSUs would be $907,640$7,570,296 for Mr. Lautenbach; $2,186,989 for Mr. Monahan; $907,640$1,229,181 for Ms. Abi-Karam;Kohnstamm; $2,186,989 for Mr. Shearer; and $628,370$1,093,469 for Ms. O’Meara.Mr. Goldstein. MSUs granted in 2012 were valued in February 2015 at a multiplier of 1.41. In 2014, CIUs, reported when paid, were replaced by PSUs, reported when awarded, under SEC guidance. This creates a “bunching” effect which makes it appear as though the LTI award value increased significantly in 2014, when in fact, it is only the disparate manner in which equity and cash is reported under SEC rules. The “bunching” effect resulted in the disclosure of additional 2014 compensation for Mr. Monahan in the amount of $910,012, and for Mr. Goldstein in the amount of $454,993, even though their long-term award values did not change. |
EXECUTIVE COMPENSATION TABLES AND RELATED NARRATIVE | (3) | This column includes the value of stock options awarded to NEOs during 2014, 2013 2012 and 20112012 based upon its grant date fair value, as determined in accordance with the share-based payment accounting guidance under ASC 718.SEC guidance. Stock options awarded to Mr. Lautenbach in 2013 and 2012, and Mr. Monahan in 2013, are premium-priced options. Details regarding outstanding stock option awards can be found in the “Outstanding Equity Awards at 20132014 Fiscal Year-End” table. | | | | | (4) | When considering all elements of the table above, the majority of compensation for the NEOs is at-risk and is earned based on company and executive performance against pre-determined financial objectives. This column includes annual incentive compensation earned in 2014, 2013 2012 and 2011,2012, and CIU payouts earned over the following award cycles: 2009–2011, 2010–20122010-2012, 2011-2013 and 2011–2013.2012-2014. For Mr. Monahan, this also includes a payout in 2012 of his performance retention award made in 2010 in connection with achievement of annualized benefits from Strategic Transformation and a 2011 IRC 162(m) objectiveobjective. As a result of $322,619,000.being hired in December 2012, Mr. Lautenbach didwas not receive aneligible for a 2012 annual incentive award for 2012.award. The 20132014 annual incentive and CIU award payout amounts in this column are as follows: for Mr. Lautenbach, annual incentive of $1,209,975;$1,519,965; for Mr. Monahan, annual incentive of $506,678,$607,806, CIU of $975,000;$864,500; for Mr. Shearer, annual incentive of $572,107; for Ms. Kohnstamm, a prorated annual incentive of $264,768; for Mr. Wright annual incentive of $328,500;$560,448; for Mr. Goldstein, annual incentive of $313,652,$369,087, CIU of $412,500; for Ms. Abi-Karam, a prorated CIU of $866,667; for Ms. O’Meara, a prorated CIU of $618,750. For Mmes. Abi-Karam and O’Meara, this includes a payout in 2013 of their 2010 performance retention awards in the amounts of $1,100,000 and $1,000,000, respectively.$432,250. The 2010 performance retention awards to Mr. Monahan (paid in 2012) and Abi-Karam (paid in 2013) and O’Meara (paid in 2013) were made as part of the board’s succession planning process at a time the board was assessing who would succeed our prior CEO. These awards were based on the achievement of financial objectives and continued employment through August 31, 2013. The 20132014 amounts in this column include payments that were deferred at the election of the NEOs under the terms of the Pitney Bowes Deferred Incentive Savings Plan, as follows: annual incentive deferral by Mr. Lautenbach deferredof 5% equal to $75,998; CIU award payout deferral of his$25,000 by Mr. Monahan; annual incentive deferral by Mr. Shearer of 5% equal to $60,499.$28,605; annual incentive deferral of $50,000 and a CIU award payout deferral of $50,000 by Mr. Goldstein. | | | | | (5) | This column shows the change in the actuarial present value of the accumulated pension benefit applicable to all eligible employees during 2014, 2013 2012 and 2011.2012. Mr. Lautenbach, Ms. Kohnstamm, Mr. Wright,Shearer, and Ms. O’MearaKohnstamm do not participate in the qualified Pension Plan or the Pension Restoration Plan. Mr. Goldstein’s pension benefit decreased in 2013 compared to year-end 2012 as a result of the impact of rising interest rates on thehis frozen pension benefit when he terminated employment in August 2008 resulting in a negative value of ($28,201), which is excluded from the sum total in accordance with SEC standards. Mr. Goldstein was not eligible to rejoin the pension plan when he was rehired in October 2010. The Pension Plan is a broad-based plan in which all employees hired prior to 2005, with certain exceptions, participate. The Pension Plan and Pension Restoration Plan were frozen to all participants on December 31, 2014. | | | | | (6) | Amounts shown for 20132014 include all other compensation received by the NEOs that is not reported elsewhere. For 2013,2014, this includes the following: for Mr. Lautenbach, the company’s actual cost for spousal travel, financial counseling, group term life insurance premium for coverage provided by the company in excess of $50,000, company match and 2% core contribution to the Pitney Bowes 401(k) Plan, and company match of $2,289$73,666 and 2% core contribution of $1,417$36,833 to the Pitney Bowes 401(k) Restoration Plan creditedearned in 2014; for Mr. Monahan, the company’s actual cost for financial counseling, group term life insurance premium for coverage provided by the company in excess of $50,000, company match to the Pitney Bowes 401(k) Plan, and company match of $24,782 to the Pitney Bowes 401(k) Restoration Plan creditedearned in 2014; for Mr. Shearer, the company’s actual cost for financial counseling, group term life insurance premium for coverage provided by the company in excess of $50,000, and company match and 2% core contribution to the Pitney Bowes 401(k) Restoration Plan earned in 2014; for Ms. Kohnstamm, group term life insurance premium for coverage provided by the company in excess of $50,000, and $200,000company match and 2% core contribution to the Pitney Bowes 401(k) Restoration Plan earned in consulting fees;2014; for Ms. Abi-Karam, $574,725 in severance and other related payments, financial counseling,Mr. Goldstein, group term life insurance premium for coverage provided by the company in excess of $50,000, company match and 2% core contribution to the Pitney Bowes 401(k) Plan, and company match of $17,466and 2% core contribution to the Pitney Bowes 401(k) Restoration Plan creditedearned in 2014; for Mr. Wright, financial counseling and group term life insurance provided by the company2014. As a result of being hired in excess of $50,000; for Mr. Goldstein, company’s actual cost for spousal travel, financial counseling, group term life insurance provided by the company in excess of $50,000, company match to Pitney Bowes 401(k) Plan, 2% core contribution to Pitney Bowes 401(k) Plan credited in 2014, company match of $16,229 and 2% core contribution to Pitney Bowes 401(k) Restoration Plan credited in 2014; for Ms. O’Meara, company’s actual cost for spousal travel, financial counseling, group term life insurance provided by the company in excess of $50,000, company match to Pitney Bowes 401(k) Plan, 2% core contribution of $5,100 to Pitney Bowes 401(k) Plan credited in 2014, company match of $7,300 and 2% core contribution of $8,126 to Pitney Bowes 401(k) Restoration Plan credited in 2014.December 2012, Mr. Lautenbach did not have any other compensation reportable in this column for 2012. | | | | | (7) | For Mr. Monahan, 2012 and 2011 amounts are amended to reflect company match to the 401(k) Restoration Plan during the years earned rather than the year credited. For Ms. Abi-Karam, the 2012 amount is amended to reflect company match to the 401(k) Restoration Plan during the year earned rather than the year credited. For Ms. O’Meara 2012 and 2011 amounts are amended to reflect company match and 2% core contributions to the 401(k) Restoration Plan during the year earned rather than the year credited. | | | | | (8) | Ms. Abi-Karam terminated employment on September 1, 2013. | | | (9) | Ms. O’Meara terminated employment on September 30, 2013.Mr. Monahan was appointed to the newly created position of Chief Operating Officer, effective February 9, 2015. He will continue his role as Chief Financial Officer, and his new title is Executive Vice President, Chief Operating Officer and Chief Financial Officer. The Summary Compensation Table reflects compensation paid to Mr. Monahan as Chief Financial Officer. |
EXECUTIVE COMPENSATION TABLES AND RELATED NARRATIVE GRANTS OF PLAN-BASED AWARDS IN 20132014 | | | | | | | | | | | | | | Estimated Future Payouts Under
Non-Equity Incentive Plan Awards | Estimated Future Payouts Under
Equity Incentive Plan Awards | All Other
Stock
Awards:
Number of
Shares of
Stock or
Units (#) | All Other
Option
Awards:
Number of
Securities
Underlying
Options (#) | Exercise
or Base
Price of
Option
Awards
($/Sh) | Grant
Date Fair Value of
Stock and
Option
Awards(2) | | Estimated Future Payouts Under
Non-Equity Incentive Plan Awards | | Estimated Future Payouts Under
Equity Incentive Plan Awards | | Grant
Date Fair | | Name | | Grant
Date | | Threshold
($) | | Target
($) | | Maximum(1)
($) | Threshold
(#) | | Target
(#) | | Maximum
(#) | | Grant
Date | | Threshold
($) | | Target
($) | | Maximum(1)
($) | | Threshold
(#) | | Target
(#) | | Maximum
(#) | | Value of
Stock and
Option
Awards(2) | | Marc B. Lautenbach | | | | | | | | | | | | | | | | | | | | | | | | | | | | | | | | | | | | | | | | (Annual Incentive)(3) | | | | 193,375 | | 1,105,000 | | 4,000,000 | | | | | | | | | | | | | 212,625 | | | 1,215,000 | | | 4,000,000 | | | | | | | | | | | | | | | (CIU)(4) | | | | 59,400 | | 2,400,000 | | 8,000,000 | | | | | | | | | | | | (Performance Stock Units)(4) | | | 2/10/2014 | | | | | | | | | | | 3,105 | | | 125,448 | | | 250,896 | | | 3,149,999 | | | (Performance-based RSUs)(5) | | 2/11/2013 | | | | | | | | | 115,523 | | | | | | 1,172,558 | | 2/10/2014 | | | | | | | | | | | | | | 53,849 | | | | | | 1,270,298 | | | (Premium-priced Stock Options)(6) | | 2/11/2013 | | | | | | | | | | | | | 400,000 | 22.16 | 148,800 | | | | | | | | | | | | | | | | | | | | | | | Michael Monahan | | | | | | | | | | | | | | | | | | | | | | | | | | | | | | | | | | | | | | | | (Annual Incentive)(3) | | | | 80,976 | | 462,720 | | 4,000,000 | | | | | | | | | | | 85,025 | | | 485,856 | | | 4,000,000 | | | | | | | | | | | | | | | (CIU)(4) | | | | 19,305 | | 780,000 | | 8,000,000 | | | | | | | | | | | | (Performance Stock Units)(4) | | | 2/10/2014 | | | | | | | | | | | 897 | | | 36,241 | | | 72,482 | | | 910,012 | | | (Performance-based RSUs)(5) | | 2/11/2013 | | | | | | | | | 37,545 | | | | | | 381,082 | | 2/10/2014 | | | | | | | | | | | | | | 15,556 | | | | | | 366,966 | | | (Premium-priced Stock Options)(7) | | 7/1/2013 | | | | | | | | | | | | | 40,000 | 17.20 | 77,160 | | | (Premium-priced Stock Options)(8) | | 7/1/2013 | | | | | | | | | | | | | 80,000 | 19.45 | 129,120 | | | (Premium-priced Stock Options)(9) | | 7/1/2013 | | | | | | | | | | | | | 120,000 | 21.69 | 163,320 | | | (Premium-priced Stock Options)(10) | | 7/1/2013 | | | | | | | | | | | | | 160,000 | 23.94 | 184,960 | | | | | | | | | | | | | | | | | | | | | | | Mark L. Shearer | | | | | | | | | | | | | | | | | | | | | | | | (Annual Incentive)(3) | | | 80,031 | | | 457,320 | | | 4,000,000 | | | | | | | | | | | | | | | (Performance Stock Units)(4) | | | 2/10/2014 | | | | | | | | | | | 897 | | | 36,241 | | | 72,482 | | | 910,012 | | | (Performance-based RSUs)(5) | | | 2/10/2014 | | | | | | | | | | | | | | 15,556 | | | | | | 366,966 | | | Abby F. Kohnstamm | | | | | | | | | | | | | | | | | | | | | | | | | | | | | | | | | | | | | | | | (Annual Incentive)(3) | | | | 42,315 | | 241,797 | | 4,000,000 | | | | | | | | | | | 78,400 | | | 448,000 | | | 4,000,000 | | | | | | | | | | | | | | | (Performance-based RSUs)(11) | | 7/1/2013 | | | | | | | | | 26,738 | | | | | | 379,947 | | | | | | | | | | | | | | | | | | | | | | | Mark F. Wright | | | | | | | | | | | | | | | | | | | | (Annual Incentive)(3) | | | | 52,500 | | 300,000 | | 4,000,000 | | | | | | | | | | | | (CIU)(4) | | | | 11,138 | | 450,000 | | 8,000,000 | | | | | | | | | | | | (Performance-based RSUs)(12) | | 5/1/2013 | | | | | | | | | 21,008 | | | | | | 260,919 | | | (Performance-based RSUs)(13) | | 5/1/2013 | | | | | | | | | 14,006 | | | | | | 189,501 | | | | | | | | | | | | | | | | | | | | | | | (Performance Stock Units)(4) | | | 2/10/2014 | | | | | | | | | | | 345 | | | 13,939 | | | 27,878 | | | 350,008 | | | (Performance-based RSUs)(5) | | | 2/10/2014 | | | | | | | | | | | | | | 5,983 | | | | | | 141,139 | | | (Performance-based RSUs)(6) | | | 2/10/2014 | | | | | | | | | | | | | | 15,955 | | | | | | 388,026 | | | Daniel J. Goldstein | | | | | | | | | | | | | | | | | | | | | | | | | | | | | | | | | | | | | | | | (Annual Incentive)(3) | | | | 50,127 | | 286,440 | | 4,000,000 | | | | | | | | | | | 51,631 | | | 295,033 | | | 4,000,000 | | | | | | | | | | | | | | | (CIU)(4) | | | | 9,653 | | 390,000 | | 8,000,000 | | | | | | | | | | | | (Performance Stock Units)(4) | | | 2/10/2014 | | | | | | | | | | | 448 | | | 18,120 | | | 36,240 | | | 454,993 | | | (Performance-based RSUs)(5) | | 2/11/2013 | | | | | | | | | 18,773 | | | | | | 190,546 | | 2/10/2014 | | | | | | | | | | | | | | 7,778 | | | | | | 183,483 | | | | | | | | | | | | | | | | | | | | | | | Leslie Abi-Karam | | | | | | | | | | | | | | | | | | | | (Annual Incentive)(3) | | | | 77,756 | | 444,320 | | 4,000,000 | | | | | | | | | | | | (CIU)(4) | | | | 19,305 | | 780,000 | | 8,000,000 | | | | | | | | | | | | (Performance-based RSUs)(5) | | 2/11/2013 | | | | | | | | | 37,545 | | | | | | 381,082 | | | | | | | | | | | | | | | | | | | | | | | Vicki A. O’Meara | | | | | | | | | | | | | | | | | | | | (Annual Incentive)(3) | | | | 73,360 | | 419,200 | | 4,000,000 | | | | | | | | | | | | (CIU)(4) | | | | 13,365 | | 540,000 | | 8,000,000 | | | | | | | | | | | | (Performance-based RSUs)(5) | | 2/11/2013 | | | | | | | | | 25,993 | | | | | | 263,829 | |
The Grants of Plan-Based awards table captures the potential threshold, target and maximum award payouts for annual incentive, CIUs,performance stock units, and performance-based RSUs, and premium-priced stock options.RSUs. | (1) | The values shown in this column represent the maximum annual incentive and CIU payout for IRC 162(m) purposes. The maximum annual incentive payout level allows the Committee sets a maximum payout atto use negative discretion in making actual annual incentive payouts reflecting actual company performance. Actual payouts have been well below IRC 162(m) maximums and more in line with threshold and target values for both the annual incentive and CIU awards.awards set by the Committee at the beginning of each year. | | | | | (2) | The amounts in this column represent the grant date fair values of RSU and stock option awardsPSU awards. The fair values are calculated in accordance with accountingSEC guidance under ASC 718 and RSUs reflect an adjustment for the exclusion of dividend equivalents during the vesting period. RSUs that vest pro-rata over three years have a fair value of $23.59; RSUs that cliff vest after one year have a fair value of $24.32. PSUs have a grant date fair value of $25.11, and are calculated based on the Monte-Carlo simulation methodology. | | | | | (3) | Values in this row represent the range in payoutpayouts for the 20132014 annual incentive award. The IRC 162(m) requires that we state the maximum payouts ana NEO could receive for annual incentive awards under the KEIP, which is $4,000,000. The Committee may applyapplies negative discretion to reduce the annual awards such that individual payments are in line with financial enterprise, business unit and/or individual performance. Ms. Kohnstamm’s 2013 annual incentive is prorated based on her June 17, 2013 date of hire. As a result of Mmes. Abi-Karam’s and O’Meara’s termination from employment, the Company is not obligated to make the 2013 annual incentive payment listed on the schedule above. | | | | | (4) | Values in this rowPSUs were granted based on the Monte-Carlo simulation methodology value of $25.11. PSUs represent a right to Pitney Bowes stock on the range in payout forvesting date, with the 2013-2015 CIU cycle. The IRC requires that we statenumber of shares determined after a specified performance period. This award is subject to achievement of the maximum payoutspre-determined annual performance metrics, a NEO could receive for long-term incentive awards under the KEIP, which is $8,000,000.three-year cumulative total shareholder return modifier, and a three-year cumulative average income from continuing operations objective. The Committee may apply negative discretion to reduce long-term awards such that payments are in line with financial enterprise performance. The target value of each CIU is $1.00. Because Mmes. Abi- |
EXECUTIVE COMPENSATION TABLES AND RELATED NARRATIVE
| KaramSee page 47 in “Compensation Discussion and O’Meara terminated employment with the company in 2013, they will receive a pro-rated payout of their 2011-2013, 2012-2014 and 2013-2015 CIU awards at the end of each respective cycle.Analysis” for additional information on this performance award. | | | | | (5) | Performance-based RSUs were granted based on the actual closing price on the February 11, 201310, 2014 grant date of $13.85. A$25.07. The performance metric tied to income from continuing operations was met as of December 31, 2013,2014, however, the awards remain subject to forfeiture over the remaining vesting period. This award will vest on a pro-rata basis over a four yearthree-year period ending February 7, 2017. | | | | | (6) | These options have an exercise price equal to 160% of the closing price of the company’s common stock on the February 11, 2013 grant date of $13.85. Based on these terms the exercise price is $22.16. The Black-Scholes value for each option granted on February 11, 2013 grant date was $0.372, based on assumptions detailed in note 12 to our financial statements included in our Annual Report on Form 10-K for the year ended December 31, 2013 as filed with the SEC on February 21, 2014. | | | (7) | These options have an exercise price equal to 115% of the closing price of the company’s common stock on the July 1, 2013 grant date of $14.96. Based on these terms the exercise price is $17.20. The Black-Scholes value for each option granted on July 1, 2013 grant date was $1.929, based on assumptions detailed in note 12 to our financial statements included in our Annual Report on Form 10-K for the year ended December 31, 2013, as filed with the SEC on February 21, 2014. | | | (8) | These options have an exercise price equal to 130% of the closing price of the company’s common stock on the July 1, 2013 grant date of $14.96. Based on these terms the exercise price is $19.45. The Black-Scholes value for each option granted on July 1, 2013 grant date was $1.614, based on assumptions detailed in note 12 to our financial statements included in our Annual Report on Form 10-K for the year ended December 31, 2013, as filed with the SEC on February 21, 2014. | | | (9) | These options have an exercise price equal to 145% of the closing price of the company’s common stock on the July 1, 2013 grant date of $14.96. Based on these terms the exercise price is $21.69. The Black-Scholes value for each option granted on July 1, 2013 grant date was $1.361, based on assumptions detailed in note 12 to our financial statements included in our Annual Report on Form 10-K for the year ended December 31, 2013, as filed with the SEC on February 21, 2014. | | | (10) | These options have an exercise price equal to 160% of the closing price of the company’s common stock on the July 1, 2013 grant date of $14.96. Based on these terms the exercise price is $23.94. The Black-Scholes value for each option granted on July 1, 2013 grant date was $1.156, based on assumptions detailed in note 12 to our financial statements included in our Annual Report on Form 10-K for the year ended December 31, 2013, as filed with the SEC on February 21, 2014. | | | (11) | Performance-based RSUs granted to Ms. Kohnstamm were based on the actual closing price on the July 1, 2013February 10, 2014 grant date of $14.96. A$25.07. The performance metric tied to income from continuing operations must bewas met as of MarchDecember 31, 2014, however, the awards remainaward remains subject to forfeiture over the remaining vesting period. This award has a one-year cliff vesting feature which vests in full on July 1, 2014. | | | (12) | Performance-based RSUs granted to Mr. Wright were based on the actual closing price on the May 1, 2013 grant date of $14.28. A performance metric tied to income from continuing operations was met as of December 31, 2013, however, the awards remain subject to forfeiture over the remaining vesting period. This award will vest on a pro-rata basis over a four year period ending February 7, 2017. | | | (13) | Performance-based RSUs granted to Mr. Wright were based on the actual closing price on the May 1, 2013 grant date of $14.28. A performance metric tied to income from continuing operations was met as of December 31, 2013, however, the awards remain subject to forfeiture over the remaining vesting period. This award has a one-year cliff vesting feature which vests in full on May 1, 2014.3, 2015. |
Stock Awards | | • | The “Stock Awards” column in the “Summary Compensation Table” represents the value of performance-based RSUs, PSUs and MSUs awarded during 2014, 2013, 2012 and 20112012 based upon the fair value for RSU awards and Monte Carlo simulation value for PSU and MSU awards. The full value of RSUs, MSUs and PSUs are disclosed in the year of the award, based on targeted number of shares. | | | | | • | In 2014, CIUs, reported when paid, were replaced by PSUs, reported when awarded under SEC guidance. This creates a “bunching” effect which makes it appear as though the LTI award value increased significantly in 2014, when in fact, it is only the disparate manner in which equity and cash is reported under SEC rules. | | | | | | | • | It is our policy that the number of stock awards to be granted is determined based on the market price of the stock on the date of grant. The 2013 Stock Plan of 2013, approved by stockholders on May 13, 2013, defines market price as the closing price for Pitney Bowes stock on the New York Stock Exchange on the date of grant. | | | | | | | • | The “Estimated Future Payouts Under Equity Incentive Plan Awards” column in the “Grants of Plan-Based Awards in 2013”2014” table shows the estimated number of performance based RSUsPSUs that maycan vest based on performance. For the performance based RSUs granted to all NEOs except Ms. Kohnstamm, a performance metric tied to income from continuing operations was met asvarying levels of December 31, 2013, however the awards remain subject to forfeiture over the remaining vesting period. Ms. Kohnstamm’s RSU grant is subject to an IFCO performance metric that ends on March 31, 2014. See page 59 (“Grants of Plan-Based Awards in 2013”). |
EXECUTIVE COMPENSATION TABLES AND RELATED NARRATIVE performance during the three-year performance period and the estimated number of performance based RSUs that may vest based on performance. For performance based RSUs granted to all NEOs, a performance metric tied to adjusted income from continuing operations was met as of December 31, 2014. The awards remain subject to forfeiture over the remaining vesting period. The vesting of the PSUs is subject to achievement of the predetermined annual performance metrics, a three-year cumulative total shareholder return modifier, and a three-year cumulative average income from continuing operations objective. The Committee may apply negative discretion to reduce long-term awards such that payments are in line with financial enterprise performance. See page 59 (“Grants of Plan-Based Awards in 2014”). Option Awards | | • | The “Option Awards” column in the “Summary Compensation Table” represents the value of options awarded during 2014, 2013, 2012 and 20112012 based upon their grant date fair value, as determined in accordance with the share-based payment accounting guidance; the “All Other Option Awards” column in the “Grants of Plan-Based Awards in 2013” table represents the number of stock options awarded to Mr. Lautenbach and Mr. Monahan during 2013.guidance. | | | | | | | • | It is our policy that stock options are granted only at an exercise price equal to or greater than the market price of the stock on the date of grant with a ten-year exercise period. The 2013 Stock Plan of 2013, approved by stockholders on May 13, 2013, defines market price as the closing price for Pitney Bowes stock on the New York Stock Exchange on the date of grant. In connection with Mr. Lautenbach’s employment, premium-priced stock options were awarded in December 2012 and February 2013. A special one-time premium-priced stock option award was made to Mr. Monahan on July 1, 2013 as a retention vehicle. See page 59 “Grants of Plan-Based Awards in 2013” table for details of Mr. Lautenbach and Mr. Monahan’s stock option awards. |
EXECUTIVE COMPENSATION TABLES AND RELATED NARRATIVE
Non-Equity Incentive Plan Compensation | | • | The values shown in the “Non-Equity Incentive Plan Compensation” column in the “Summary Compensation Table” include the annual incentive payments earned for 2014, 2013, 2012 and 2011,2012, as well as the CIUs that were earned over the three-year periods ending December 31, 2013,2014, December 31, 20122013 and December 31, 2011. The 2011 amounts include the final February 2011 vesting of the 2008 performance award. The 2013 amounts for Mmes. Abi-Karam and O’Meara include the payment of performance-based cash awards granted in 2010. For additional details of the 2010 award to Mmes. Abi-Karam and O’Meara see page 68.2012. | | | | | | | • | The “Estimated Future Payouts Under Non-Equity Incentive Plan Awards” column in the “Grants of Plan-Based Awards in 2013”2014” table show the range of estimated possible future payouts for the 20132014 annual incentive payment at varying levels of performance. They also show the range of estimated possible future payouts of the CIUs granted for the 2013–2015 cycle at varying levels of performance. |
Change in Pension Value and Nonqualified Deferred Compensation Earnings | | • | The “Change in Pension Value and Nonqualified Deferred Compensation Earnings” column in the “Summary Compensation Table” reflects the change in pension value for each of the years shown. | | | | | | | • | The change in pension value reflects the aggregate change for both the Pension Plan and the Pitney Bowes Pension Restoration Plan. | | | | | | | • | There were no above-market deferred compensation earnings credited to the Pension Restoration Plan. | | | | | | | • | The Pitney Bowes Pension Restoration Plan provides benefits that would otherwise be provided inunder the qualified Pension Plan but for IRS limitations applicable to the qualified Pension Plan. |
All Other Compensation The “All Other Compensation” column in the “Summary Compensation Table” consists of other amounts earned or paid to each NEO, including the qualified 401(k) Plan and the non-qualified 401(k) Restoration Plan. There were no above-market deferred compensation earnings credited to the 401(k) Restoration Plan. Many of the benefits described in this column are available to employees other than the NEOs. Equity Awards The next table is provided to present an overview of Pitney Bowes equity awards held as of December 31, 20132014 by each NEO. It discloses compensation in the form of equity that has previously been awarded, remains outstanding, and is unexercised or unvested. EXECUTIVE COMPENSATION TABLES AND RELATED NARRATIVE OUTSTANDING EQUITY AWARDS AT 20132014 FISCAL YEAR-END The following table provides information on the current holdings of stock option and stock awards by the NEOs. This table includes unexercised or unvested option awards, unvested RSUs, PSUs and unvested MSUs. Each equity grant is shown separately for each NEO. The vesting schedule for each outstanding award is shown following this table(1). For additional information about the stock option and stock awards, see the description of equity incentive compensation in “Compensation Discussion and Analysis” beginning on page 47.32. | | | | | Option Awards | | Stock Awards | | Name | | Grant Date | | Number of
Securities
Underlying
Unexercised
Options (#)
Exercisable | | Number of
Securities
Underlying
Unexercised
Options (#)
Unexercisable | | Option
Exercise
Price
($) | | Option
Expiration
Date | | Unrealized
Appreciation
($)(2) | | Number
of Shares
or Units
of Stock
That Have
Not Vested
(#) | | Market Value
of Shares
or Units
of Stock
That Have
Not Vested
($)(3) | | Equity
Incentive
Plan Awards:
Number
of Unearned
Shares, Units
or Other Rights
That Have
Not Vested
(#) | | Equity
Incentive
Plan Awards:
Market or
Payout Value
of Unearned
Shares, Units
or Other Rights
That Have
Not Vested
($)(3) | | Marc B. Lautenbach | | 12/3/2012 | | 25,000 | | | 75,000 | | | 13.3860 | | 12/3/2022 | | | 991,400 | | | — | | | — | | | — | | | — | | | | | 12/3/2012 | | 50,000 | | | 150,000 | | | 15.1320 | | 12/3/2022 | | | 1,633,600 | | | — | | | — | | | — | | | — | | | | | 12/3/2012 | | 75,000 | | | 225,000 | | | 16.8780 | | 12/3/2022 | | | 1,926,600 | | | — | | | — | | | — | | | — | | | | | 2/11/2013 | | 100,000 | | | 300,000 | | | 22.1600 | | 12/2/2022 | | | 456,000 | | | — | | | — | | | — | | | — | | | | | 2/11/2013 | | — | | | — | | | — | | — | | | 0 | | | 115,523 | | | 2,691,686 | | | — | | | — | | | Michael Monahan | | 2/9/2004 | | 23,000 | | | 0 | | | 40.0800 | | 2/8/2014 | | | 0 | | | — | | | — | | | — | | | — | | | | | 2/14/2005 | | 26,000 | | | 0 | | | 46.9300 | | 2/13/2015 | | | 0 | | | — | | | — | | | — | | | — | | | | | 2/13/2006 | | 28,050 | | | 0 | | | 42.6200 | | 2/12/2016 | | | 0 | | | — | | | — | | | — | | | — | | | | | 2/12/2007 | | 28,777 | | | 0 | | | 48.0300 | | 2/11/2017 | | | 0 | | | — | | | — | | | — | | | — | | | | | 2/11/2008 | | 153,846 | | | 0 | | | 36.9600 | | 2/10/2018 | | | 0 | | | — | | | — | | | — | | | — | | | | | 2/9/2009 | | 90,461 | | | 0 | | | 24.7500 | | 2/8/2019 | | | 0 | | | — | | | — | | | — | | | — | | | | | 2/8/2010 | | 106,383 | | | 0 | | | 22.0900 | | 2/7/2020 | | | 128,723 | | | — | | | — | | | — | | | — | | | | | 2/8/2010 | | — | | | — | | | — | | — | | | — | | | 3,395 | | | 79,104 | | | — | | | — | | | | | 2/14/2011 | | 62,802 | | | 27,566 | | | 26.0700 | | 2/13/2021 | | | 0 | | | — | | | — | | | — | | | — | | | | | 2/14/2011 | | 0 | | | 3,835 | | | 26.0700 | | 2/13/2021 | | | 0 | | | — | | | — | | | — | | | — | | | | | 2/14/2011 | | — | | | — | | | — | | — | | | — | | | 6,233 | | | 145,229 | | | — | | | — | | | | | 2/13/2012 | | — | | | — | | | — | | — | | | — | | | 13,190 | | | 307,327 | | | — | | | — | | | | | 2/13/2012 | | — | | | — | | | — | | — | | | — | | | — | | | — | | | 18,146 | | | 422,802 | | | | | 2/11/2013 | | — | | | — | | | — | | — | | | — | | | 37,545 | | | 874,799 | | | — | | | — | | | | | 7/1/2013 | | — | | | 40,000 | | | 17.2000 | | 6/30/2023 | | | 244,000 | | | — | | | — | | | — | | | — | | | | | 7/1/2013 | | — | | | 80,000 | | | 19.4500 | | 6/30/2023 | | | 308,000 | | | — | | | — | | | — | | | — | | | | | 7/1/2013 | | — | | | 120,000 | | | 21.6900 | | 6/30/2023 | | | 193,200 | | | — | | | — | | | — | | | — | | | | | 7/1/2013 | | — | | | 160,000 | | | 23.9400 | | 6/30/2023 | | | — | | | — | | | — | | | — | | | — | | | Abby F. Kohnstamm | | 7/1/2013 | | — | | | — | | | — | | — | | | — | | | — | | | — | | | 26,738 | | | 622,995 | | | Mark F. Wright | | 5/1/2013 | | — | | | — | | | — | | — | | | — | | | 21,008 | | | 489,486 | | | — | | | — | | | | | 5/1/2013 | | — | | | — | | | — | | — | | | — | | | 14,006 | | | 326,340 | | | — | | | — | | | Daniel J. Goldstein | | 10/18/2010 | | — | | | — | | | — | | — | | | — | | | 4,638 | | | 108,065 | | | — | | | — | | | | | 2/14/2011 | | 18,900 | | | 9,450 | | | 26.0700 | | 2/13/2021 | | | — | | | — | | | — | | | — | | | — | | | | | 2/14/2011 | | 7,670 | | | 3,835 | | | 26.0700 | | 2/13/2021 | | | — | | | — | | | — | | | — | | | — | | | | | 2/14/2011 | | — | | | — | | | — | | — | | | — | | | 2,637 | | | 61,442 | | | — | | | — | | | | | 2/13/2012 | | — | | | — | | | — | | — | | | — | | | 6,595 | | | 153,664 | | | — | | | — | | | | | 2/13/2012 | | — | | | — | | | — | | — | | | — | | | — | | | — | | | 9,073 | | | 211,401 | | | | | 2/11/2013 | | — | | | — | | | — | | — | | | — | | | 18,773 | | | 437,411 | | | — | | | — | | | Leslie Abi-Karam | | 2/9/2004 | | 18,000 | | | 0 | | | 40.0800 | | 2/8/2014 | | | 0 | | | — | | | — | | | — | | | — | | | | | 2/14/2005 | | 25,000 | | | 0 | | | 46.9300 | | 2/13/2015 | | | 0 | | | — | | | — | | | — | | | — | | | | | 2/13/2006 | | 28,050 | | | 0 | | | 42.6200 | | 2/12/2016 | | | 0 | | | — | | | — | | | — | | | — | | | | | 2/12/2007 | | 28,777 | | | 0 | | | 48.0300 | | 2/11/2017 | | | 0 | | | — | | | — | | | — | | | — | | | | | 2/11/2008 | | 153,846 | | | 0 | | | 36.9600 | | 2/10/2018 | | | 0 | | | — | | | — | | | — | | | — | | | | | 2/9/2009 | | 90,461 | | | 0 | | | 24.7500 | | 2/8/2019 | | | 0 | | | — | | | — | | | — | | | — | | | | | 2/8/2010 | | 106,383 | | | 0 | | | 22.0900 | | 2/7/2020 | | | 128,723 | | | — | | | — | | | — | | | — | | | | | 2/14/2011 | | 62,802 | | | 27,566 | | | 26.0700 | | 2/13/2021 | | | 0 | | | — | | | — | | | — | | | — | | | | | 2/14/2011 | | 0 | | | 3,835 | | | 26.0700 | | 2/13/2021 | | | 0 | | | — | | | — | | | — | | | — | | | | | 2/13/2012 | | — | | | — | | | — | | — | | | — | | | — | | | — | | | 18,146 | | | 422,802 | |
(Table continued on next page)
| | | | | Option Awards | | Stock Awards | | | | | | | | | | | | | | | | | | | | | | Equity | | | | | | | | | | | | | | | | | | | | Equity | | Incentive | | | | | | | | | | | | | | | | | | | | Incentive | | Plan Awards: | | | | | | | | | | | | | | | | | | | | Plan Awards: | | Market or | | | | | | | | | | | | | | | | Number | | Market Value | | Number | | Payout Value | | Name | | Grant Date | | Number of
Securities
Underlying
Unexercised
Options (#)
Exercisable | | Number of
Securities
Underlying
Unexercised
Options (#)
Unexercisable | | Option
Exercise
Price
($) | | Option
Expiration
Date | | Unrealized
Appreciation
($)(2) | | of Shares
or Units
of Stock
That Have
Not Vested
(#) | | of Shares
or Units
of Stock
That Have
Not Vested
($)(3) | | of Unearned
Shares, Units
or Other Rights
That Have
Not Vested
(#) | | of Unearned
Shares, Units
or Other Rights
That Have
Not Vested
($)(3) | | Marc B. Lautenbach | | 12/3/2012 | | 50,000 | | | 50,000 | | | 13.3860 | | | 12/3/2022 | | 1,098,400 | | | — | | | — | | | — | | | — | | | | | 12/3/2012 | | 100,000 | | | 100,000 | | | 15.1320 | | | 12/3/2022 | | 1,847,600 | | | — | | | — | | | — | | | — | | | | | 12/3/2012 | | 150,000 | | | 150,000 | | | 16.8780 | | | 12/3/2022 | | 2,247,600 | | | — | | | — | | | — | | | — | | | | | 2/11/2013 | | 200,000 | | | 200,000 | | | 22.1600 | | | 12/2/2022 | | 884,000 | | | — | | | — | | | — | | | — | | | | | 2/11/2013 | | — | | | — | | | — | | | — | | — | | | 86,642 | | | 2,111,466 | | | — | | | — | | | | | 2/10/2014 | | — | | | — | | | — | | | — | | — | | | 53,849 | | | 1,312,300 | | | — | | | — | | | | | 2/10/2014 | | — | | | — | | | — | | | — | | — | | | — | | | — | | | 237,097 | | | 5,778,047 | | | Michael Monahan | | 2/14/2005 | | 26,000 | | | 0 | | | 46.9300 | | | 2/13/2015 | | 0 | | | — | | | — | | | — | | | — | | | | | 2/13/2006 | | 28,050 | | | 0 | | | 42.6200 | | | 2/12/2016 | | 0 | | | — | | | — | | | — | | | — | | | | | 2/12/2007 | | 28,777 | | | 0 | | | 48.0300 | | | 2/11/2017 | | 0 | | | — | | | — | | | — | | | — | | | | | 2/11/2008 | | 153,846 | | | 0 | | | 36.9600 | | | 2/10/2018 | | 0 | | | — | | | — | | | — | | | — | | | | | 2/9/2009 | | 90,461 | | | 0 | | | 24.7500 | | | 2/8/2019 | | 0 | | | — | | | — | | | — | | | — | | | | | 2/8/2010 | | 106,383 | | | 0 | | | 22.0900 | | | 2/7/2020 | | 242,553 | | | — | | | — | | | — | | | — | | | | | 2/14/2011 | | 94,203 | | | 0 | | | 26.0700 | | | 2/13/2021 | | 0 | | | — | | | — | | | — | | | — | | | | | 2/14/2011 | | — | | | — | | | — | | | — | | — | | | 3,116 | | | 75,937 | | | — | | | — | | | | | 2/13/2012 | | — | | | — | | | — | | | — | | — | | | 8,793 | | | 214,285 | | | — | | | — | | | | | 2/13/2012 | | — | | | — | | | — | | | — | | — | | | — | | | — | | | 18,146 | | | 442,218 | | | | | 2/11/2013 | | — | | | — | | | — | | | — | | — | | | 28,159 | | | 686,235 | | | — | | | — | | | | | 7/1/2013 | | — | | | 40,000 | | | 17.2000 | | | 6/30/2023 | | 286,800 | | | — | | | — | | | — | | | — | | | | | 7/1/2013 | | — | | | 80,000 | | | 19.4500 | | | 6/30/2023 | | 393,600 | | | — | | | — | | | — | | | — | | | | | 7/1/2013 | | — | | | 120,000 | | | 21.6900 | | | 6/30/2023 | | 321,600 | | | — | | | — | | | — | | | — | | | | | 7/1/2013 | | — | | | 160,000 | | | 23.9400 | | | 6/30/2023 | | 68,800 | | | — | | | — | | | — | | | — | | | | | 2/10/2014 | | — | | | — | | | — | | | — | | — | | | 15,556 | | | 379,100 | | | — | | | — | | | | | 2/10/2014 | | — | | | — | | | — | | | — | | — | | | — | | | — | | | 68,495 | | | 1,669,235 | | | Mark L. Shearer | | 5/1/2013 | | — | | | — | | | — | | | — | | — | | | 27,311 | | | 665,569 | | | — | | | — | | | | | 2/10/2014 | | — | | | — | | | — | | | — | | — | | | 15,556 | | | 379,100 | | | — | | | — | | | | | 2/10/2014 | | — | | | — | | | — | | | — | | — | | | — | | | — | | | 68,495 | | | 1,669,235 | | | Abby F. Kohnstamm | | 2/10/2014 | | — | | | — | | | — | | | — | | — | | | 5,983 | | | 145,806 | | | — | | | — | | | | | 2/10/2014 | | — | | | — | | | — | | | — | | — | | | 15,955 | | | 388,823 | | | — | | | — | | | | | 2/10/2014 | | — | | | — | | | — | | | — | | — | | | — | | | — | | | 26,345 | | | 642,021 | | | Daniel J. Goldstein | | 2/14/2011 | | 39,855 | | | — | | | 26.0700 | | | 2/13/2021 | | 0 | | | — | | | — | | | — | | | — | | | | | 2/14/2011 | | — | | | — | | | — | | | — | | — | | | 1,318 | | | 32,120 | | | — | | | — | | | | | 2/13/2012 | | — | | | — | | | — | | | — | | — | | | 4,396 | | | 107,131 | | | — | | | — | | | | | 2/13/2012 | | — | | | — | | | — | | | — | | — | | | — | | | — | | | 9,073 | | | 221,109 | | | | | 2/11/2013 | | — | | | — | | | — | | | — | | — | | | 14,080 | | | 343,130 | | | — | | | — | | | | | 2/10/2014 | | — | | | — | | | — | | | — | | — | | | 7,778 | | | 189,550 | | | — | | | — | | | | | 2/10/2014 | | — | | | — | | | — | | | — | | — | | | — | | | — | | | 34,247 | | | 834,595 | | | (Table continued on next page) | | | | | | | | | | | | | | | | | | | | | |
EXECUTIVE COMPENSATION TABLES AND RELATED NARRATIVE | | | | | Option Awards | Stock Awards | | Name | | Grant Date | | Number of
Securities
Underlying
Unexercised
Options (#)
Exercisable | | Number of
Securities
Underlying
Unexercised
Options (#)
Unexercisable | | Option
Exercise
Price
($) | | Option
Expiration
Date | | Unrealized
Appreciation
($)(2) | | Number
of Shares
or Units
of Stock
That Have
Not Vested
(#) | | Market Value
of Shares
or Units
of Stock
That Have
Not Vested
($)(3) | | Equity
Incentive
Plan Awards:
Number
of Unearned
Shares, Units
or Other Rights
That Have
Not Vested
(#) | | Equity
Incentive
Plan Awards:
Market or
Payout Value
of Unearned
Shares, Units
or Other Rights
That Have
Not Vested
($)(3) | | Vicki A. O’Meara | | 8/27/2008 | | 50,000 | | | 0 | | | 33.9100 | | 8/27/2018 | | | 0 | | | — | | | — | | | — | | | — | | | | | 2/9/2009 | | 53,454 | | | 0 | | | 24.7500 | | 2/8/2019 | | | 0 | | | — | | | — | | | — | | | — | | | | | 2/8/2010 | | 57,624 | | | 0 | | | 22.0900 | | 2/7/2020 | | | 69,725 | | | — | | | — | | | — | | | — | | | | | 2/14/2011 | | 43,478 | | | 17,904 | | | 26.0700 | | 2/13/2021 | | | 0 | | | — | | | — | | | — | | | — | | | | | 2/14/2011 | | 0 | | | 3,835 | | | 26.0700 | | 2/13/2021 | | | 0 | | | — | | | — | | | — | | | — | | | | | 2/13/2012 | | — | | | — | | | — | | — | | | — | | | — | | | — | | | 12,563 | | | 292,718 | | | | | 2/11/2013 | | — | | | — | | | — | | — | | | — | | | 25,993 | | | 605,637 | | | — | | | — | |
(1) | Option and Stock Awards Vesting Schedule |
| Grant Date | | Award Type | | Name of Executive | | Vesting Schedule (as of December 31, 2013) | 2/8/2010 | | RSU | | Monahan | | remaining 25% vests on February 4, 2014 | 10/18/2010 | | RSU | | Goldstein | | remaining 33% vests on February 4, 2014 | 2/14/2011 | | NQSO | | Monahan, Abi-Karam, O’Meara, Goldstein | | remaining 33% vests on February 14, 2014 | 2/14/2011 | | ISO | | Monahan, Abi-Karam, O’Meara, Goldstein | | 100% vests on February 14, 2014 | | 2/14/2011 | | RSU | | Monahan, Goldstein | | Four year vesting; 50%25% remains unvested; 25% vestsvested on February 4, 2014 and February 3, 2015 | | 2/13/2012 | | RSU | | Monahan, Goldstein | | Four year vesting; 75%50% remains unvested; 25% vestsvested on February 4, 2014, February 3, 2015 and 25% vests on February 2, 2016 | | 2/13/2012 | | MSU | | Monahan, Abi-Karam, O’Meara, Goldstein | | 100% vestsvested on February 3, 2015 | | 12/3/2012 | | NQSO | | Lautenbach | | Four year vesting; 75%50% remains unvested; 25% vests on December 3, 2014, December 3, 2015 and 25% vests on December 3, 2016 | | 2/11/2013 | | NQSO | | Lautenbach | | Four year vesting; 75%50% remains unvested; 25% vests on December 3, 2014, December 3, 2015 and 25% vests on December 3, 2016 | | 2/11/2013 | | RSU | | Lautenbach, Monahan, O’Meara, Goldstein | | Four year vesting; 100%75% remains unvested; 25% vested on February 3, 2015, 25% vests on February 4, 2014, February 3, 2015, February 2, 2016 and 25% vests on February 7, 2017 | | 5/1/2013 | | RSU | | WrightShearer | | Four year vesting for 21,008 units; 100%vesting; 75% remains unvested; 25% vested on February 3, 2015, 25% vests on February 4, 2014, February 3, 2015, February 2, 2016 and 25% vests on February 7, 2017 | 5/1/2013 | | RSU | | Wright | | 100% of 14,006 units vests on May 1, 2014 | | 7/1/2013 | | NQSO | | Monahan | | Three year vesting; 100% remains unvested; 33% vestsvested on February 3, 2015, 33% vests on February 2, 2016 and 33% vests on February 7, 2017 | 7/1/20132/10/2014 | | PSU | | Lautenbach, Monahan, Shearer,
Kohnstamm, Goldstein | | Three year cliff vesting; 100% vests on February 7, 2017 | | 2/10/2014 | | RSU | | Lautenbach, Monahan, Shearer,
Kohnstamm, Goldstein | | Three year vesting; 100% remains unvested; 33% vested on February 3, 2015, 33% vests on February 2, 2016 and 33% vests on February 7, 2017 | | 2/10/2014 | | RSU | | Kohnstamm | | 100 % vestsOne year vesting; 100% vested on July 1, 2014February 3, 2015 |
| | | (1) | Option and Stock Awards Vesting Schedule | | | | (2) | This column represents the difference between the exercise price on the date of grant and the closing price of the company stock on December 31, 20132014 for outstanding exercisable and unexercisable options which have not yet been realized. | | | | | (3) | These amounts were calculated based on the closing price of the company’s common stock of $23.30$24.37 per share on December 31, 2013. For MSUs,2014. MSU values wereare calculated using the target number of shares granted. The total number of MSUs that can vest is capped at 200% of the target number of MSUs granted. A minimum number of shares,MSUs, 50% of the target award, will vest at the end of the three yearthree-year performance period. PSU values shown are calculated as follows: (i) the target number of shares awarded, multiplied by (ii) the maximum estimated performance factor for the 2014-2016 cycle, 1.89, based on 2014 results, further multiplied by (iii) a 0% TSR adjustment based on 2014 target relative performance versus the company’s peer group, and (iv) further multiplied by $24.37. The total number of PSUs that can vest is capped at 200% of the number of PSUs granted. |
EXECUTIVE COMPENSATION TABLES AND RELATED NARRATIVE OPTION EXERCISES AND STOCK VESTED DURING 20132014 FISCAL YEAR(1) | | | Option Awards | | Stock Awards | | Name | | Number of
Shares Acquired
on Exercise (#) | | Value Realized
on Exercise ($) | | Number of
Shares Acquired
on Vesting (#)(2) | | Value Realized
on Vesting ($) | | Marc B. Lautenbach | | 0 | | | 0 | | | 0 | | | 0 | | | Michael Monahan | | 0 | | | 0 | | | 13,686 | | | 181,955 | (3) | | Abby F. Kohnstamm | | 0 | | | 0 | | | 0 | | | 0 | | | Mark F. Wright | | 0 | | | 0 | | | 0 | | | 0 | | | Daniel J. Goldstein | | 0 | | | 0 | | | 8,155 | | | 108,421 | (3) | | Leslie Abi-Karam | | 0 | | | 0 | | | 36,504 | | | 696,958 | (4) | | Vicki A. O’Meara | | 0 | | | 0 | | | 33,830 | | | 544,700 | (5) |
| | | Option Awards | | Stock Awards | | | | Number of | | | | Number of | | | | | | Shares Acquired | | Value Realized | | Shares Acquired | | Value Realized | | Name | | on Exercise (#) | | on Exercise ($) | | on Vesting (#)(1) | | on Vesting ($) | | Marc B. Lautenbach | | 0 | | | 0 | | | 28,881 | | | 714,516 | (2) | | Michael Monahan | | 0 | | | 0 | | | 20,295 | | | 502,098 | (2) | | Mark L. Shearer | | 0 | | | 0 | | | 9,104 | | | 225,233 | (2) | | Abby F. Kohnstamm | | 0 | | | 0 | | | 26,738 | | | 736,365 | (3) | | Daniel J. Goldstein | | 0 | | | 0 | | | 12,849 | | | 317,884 | (2) |
| | | (1) | Mr. Lautenbach, Ms. KohnstammPerformance-based RSUs granted on February 8, 2010, October 18, 2010, February 14, 2011, February 13, 2012, February 11, 2013 and Mr. Wright did not have any stock option exercises or stock vest during 2013.May 1, 2013 had a pro-rata vesting on February 4, 2014; Performance-based RSUs granted on July 1, 2013 vested on July 1, 2014. | | | | | (2) | Performance-based RSUs granted on February 9, 2009, February 8, 2010, February 14, 2011 and February 13, 2012 had a pro-rata vesting on February 5, 2013. | | | (3) | These values were determined based on the average of the high and low trading price on the February 5, 20134, 2014 vesting date of $13.30.$24.74. | | | | (4)(3) | For Ms. Abi-Karam, values for 13,686 RSUs wereThis value was determined based on the average of the high and low trading price on the February 5, 2013July 1, 2014 vesting date of $13.30; values for 22,818 RSUs were determined based on the average of the high and low trading price on the November 14, 2013 vesting date of $22.57, the date she became eligible for early retirement. | | | (5) | For Ms. O’Meara, values for 14,297 RSUs were determined based on the average of the high and low trading price on the February 5, 2013 vesting date of $13.30; values for 19,533 RSUs were determined based on the average of the high and low trading price on the September 30, 2013 vesting date of $18.16.$27.54. |
Pension Benefits The following table provides information regarding pension payments to the NEOs. It includes data regarding the Pitney Bowes Pension Plan and the Pension Restoration Plan. U.S. NEOs hired prior to January 1, 2005 are eligible to participate in the Pitney Bowes Pension Plan which is a broad-based tax-qualified plan under which employees generally are eligible to retire with unreduced benefits at age 65. U.S. NEOs who participate in the Pitney Bowes Pension Plan are also eligible to participate in the Pension Restoration Plan, a nonqualified deferred compensation plan, which provides benefits based on the same formula used under the qualified plan to eligible employees with compensation greater than the $255,000$260,000 IRC compensation limit for 20132014 and to those employees who defer portions of their compensation under the Deferred Incentive Savings Plan. The Pension Restoration Plan is offered to approximately 225175 of our current active employees. Benefits under the Pension Restoration Plan are substantially equal to the difference between the amount that would have been payable under our qualified Pension Plan, absent IRS limits on compensation and benefits, and the amount actually paid under our qualified Pension Plan. Payments under the nonqualified Pension Restoration Plan are made out of the company’s general assets. The Pension Restoration Plan does not provide above-market interest rates on deferred compensation. All of the eligible NEOs are fully vested in their pension benefit. In 2009,As previously approved by the board of directors, approved freezing the qualified Pension Plan and nonqualified Pension Restoration Plan were frozen for all participants, effective December 31, 2014. Mr. Monahan is the only active NEO accruing benefitsThere will be no further accruals under the pension plans.qualified Pension Plan or the nonqualified Pension Restoration Plan, except as required by law. (See discussion under “Other Indirect Compensation” on page 48 of this proxy statement.)
The amounts reported in the table below equal the present value of the accumulated benefit on December 31, 2013,2014, for the NEOs under the Pitney Bowes pension plans determined based on years of service and covered earnings (as described below). The present value has been calculated based on benefits payable commencing upon the executive attaining age 65, and in an amount consistent with the assumptions as described in note 1813 to the financial statements included in the Annual Report on Form 10-K for the year ended December 31, 2013,2014, as filed with the SEC on February 21, 2014.20, 2015. EXECUTIVE COMPENSATION TABLES AND RELATED NARRATIVE PENSION BENEFITS AS OF DECEMBER 31, 20132014(1) | Name | | Plan Name | | Number of Years
Credited Service (#) | | Present Value of
Accumulated Benefit ($)(2) | | Michael Monahan | | Pitney Bowes Pension Plan | | 25.6 | | | 336,869 | | | Michael Monahan | | Pitney Bowes Pension Restoration Plan | | 25.6 | | | 1,301,278 | | | Daniel J. Goldstein | | Pitney Bowes Pension Plan | | 8.9 | | | 95,000 | | | Daniel J. Goldstein | | Pitney Bowes Pension Restoration Plan | | 8.9 | | | 56,497 | | | Leslie Abi-Karam | | Pitney Bowes Pension Plan | | 29.9 | | | 515,844 | | | Leslie Abi-Karam | | Pitney Bowes Pension Restoration Plan | | 29.9 | | | 2,086,295 | |
| | | | | Number of Years | | Present Value of | | Name | | Plan Name | | Credited Service (#) | | Accumulated Benefit ($)(2) | | Michael Monahan | | Pitney Bowes Pension Plan | | 26.6 | | | 368,113 | | | Michael Monahan | | Pitney Bowes Pension Restoration Plan | | 26.6 | | | 1,432,248 | | | Daniel J. Goldstein | | Pitney Bowes Pension Plan | | 8.9 | | | 112,687 | | | Daniel J. Goldstein | | Pitney Bowes Pension Restoration Plan | | 8.9 | | | 78,846 | |
| | | (1) | Mr. Lautenbach, Ms. Kohnstamm, Mr. WrightShearer and Ms. O’MearaKohnstamm are omitted from this table since they are not Pension Planpension plan participants. Mr. Goldstein is not currently participating in the Pension Plan, but has a prior accumulated benefit under the plans. Active employees who do not participate in the Pension Planpension plan are eligible for a 2% core contribution in the 401(k) Plan. See “Deferred Compensation” section below. Ms. Abi-Karam continues to accrue a pension benefit during the severance period. | | | | | (2) | Material assumptions used to calculate the present value of accumulated benefits under the Pitney Bowes Pension Plan for each NEOMessrs. Monahan and Goldstein are detailed in note 1813 to the financial statements included in the Annual Report on Form 10-K for the year ended December 31, 2013.2014. These lump sum values are expressed as the greater of the Pension Equity Account and the Present Value of the Age 65 Accrued benefit using the IRC 417(e)(3) mortality table. |
The material terms of the Pitney Bowes Pension Plan and Pension Restoration Plan are as follows: | | • | Only U.S. employees hired prior to January 1, 2005 are eligible to participate. | | | | | | | • | Normal retirement age is 65 with at least three years of service, while early retirement is allowed at age 55 with at least ten years of service. | | | | | | | • | The vesting period is three years. | | | | | | | • | For purposes of determining pension benefits, “earnings” are defined as the average of the five highest consecutive calendar year pay amounts. Earnings include base salary, vacation, severance, before-tax plan contributions, annual incentives (paid and deferred), and certain bonuses. Earnings do not include CIU payments, stock options, restricted stock, RSUs, PSUs, MSUs, hiring bonuses, company contributions to benefits, and expense reimbursements. | | | | | | | • | The formula to determine benefits is based on age, years of service, and final average of the highest consecutive five-year earnings. Employees receive annual percentages of earnings based on their age plus service. The annual percentages range from 2% to 10% of final average earnings up to the Social Security Wage Base, plus 2% to 6% of such earnings in excess of the Social Security Wage Base. In addition, Pitney Bowes Pension Plan participants whose age plus service totaled more than 50 as of September 1, 1997 receive “transition credits” to make up for some of the differences between old and new retirement plan formulas. Mr. Monahan and Ms. Abi-Karam areis among those Pitney Bowes Pension Plan participants who earned “transition credits.” | | | | | | | • | The maximum benefit accrual under the Pitney Bowes Pension Restoration Plan is an amount equal to 16.5% multiplied by the participant’s final average earnings and further multiplied by the participant’s credited service. | | | | | | | • | Upon retirement, benefits are payable in a lump-sum or various annuity forms, including life annuity and 50% joint and survivor annuity. | | | | | | | • | The distribution options under the Pitney Bowes Pension Restoration Plan are designed to comply with the requirements of IRC 409A of the Code. | | | | | | | • | The company has not provided extra years of credited servicesservice to any of the NEOs. | | | | | • | The Pitney Bowes Pension Plan and Pension Restoration Plan were frozen for all participants effective December 31, 2014. |
Deferred Compensation Information included in the table below includes contributions, earnings, withdrawals, and balances with respect to the Pitney Bowes 401(k) Restoration Plan (a nonqualified deferred compensation plan restoring benefits that would have otherwise been made in the qualified 401(k) Plan but for IRC limitations) and the Pitney Bowes Deferred Incentive Savings Plan (a nonqualified deferred compensation plan where certain employees may defer their incentives and base salary). The Pitney Bowes 401(k) Restoration Plan and Deferred Incentive Savings Plan, which we refer to as the DISP, are unfunded plans established for a select group of management or highly compensated employees under ERISA. All payments pursuant to the plans are made from the general assets of the company and are subject to the company’s creditors. Participants do not own any interest in the assets of the company as a result of participating in the plans. The company reserves the right to fund a grantor trust to assist in accumulating funds to pay the company’s obligations under the plans. Any assets of the grantor trusts are subject to the claims of the company’s creditors. Beginning with RSU and PSU awards made in February 2015, executives who are required to own certain levels of company stock under the executive stock ownership policy may elect to defer the settlement of RSUs and PSUs upon vesting until the executives terminate employment or retire. Executives who choose to defer in this manner receive dividend equivalents once the award vests, which are also deferred as RSUs. Deferred RSUs and PSUs are unfunded deferred compensation subject to the company’s general creditors. EXECUTIVE COMPENSATION TABLES AND RELATED NARRATIVE NONQUALIFIED DEFERRED COMPENSATION FOR 20132014(1) | | | | Executive | | Registrant | | Aggregate | | Aggregate | | Aggregate | | | | | | Contributions | | Contributions | | Earnings/(Loss) | | Withdrawals/ | | Balance at | | | Name | | | in Last FY ($)(2) | | in Last FY ($)(3) | | in Last FY ($)(4) | | Distributions ($) | | Last FYE ($)(5) | | | Marc B. Lautenbach | | | | | | | | | | | | | | | | | | | 401(k) Restoration Plan | | | — | | | — | | | — | | | 0 | | | — | | | | Deferred Incentive Savings Plan | | | — | | | — | | | — | | | 0 | | | — | | | | Michael Monahan | | | | | | | | | | | | | | | | | | | 401(k) Restoration Plan | | | — | | | 12,000 | | | 66,387 | | | 0 | | | 193,635 | | | | Deferred Incentive Savings Plan | | | 25,000 | | | — | | | 177,142 | | | 0 | | | 1,164,647 | | | | Abby F. Kohnstamm | | | | | | | | | | | | | | | | | | | 401(k) Restoration Plan | | | — | | | — | | | — | | | 0 | | | — | | | | Deferred Incentive Savings Plan | | | — | | | — | | | — | | | 0 | | | — | | | | Mark F. Wright | | | | | | | | | | | | | | | | | | | 401(k) Restoration Plan | | | — | | | — | | | — | | | 0 | | | — | | | | Deferred Incentive Savings Plan | | | — | | | — | | | — | | | 0 | | | — | | | | Daniel J. Goldstein | | | | | | | | | | | | | | | | | | | 401(k) Restoration Plan | | | — | | | 29,857 | | | 7,245 | | | 0 | | | 51,972 | | | | Deferred Incentive Savings Plan | | | 50,000 | | | — | | | 19,118 | | | 0 | | | 122,005 | | | | Leslie Abi-Karam | | | | | | | | | | | | | | | | | | | 401(k) Restoration Plan | | | — | | | 22,000 | | | 23,142 | | | 0 | | | 144,764 | | | | Deferred Incentive Savings Plan | | | 20,000 | | | — | | | 1,404 | | | 0 | | | 129,820 | | | | Vicki A. O’Meara | | | | | | | | | | | | | | | | | | | 401(k) Restoration Plan | | | — | | | 20,525 | | | 1,380 | | | 0 | | | 67,759 | | | | Deferred Incentive Savings Plan | | | 0 | | | — | | | 0 | | | 0 | | | 0 | | |
| | | | Executive | | Registrant | | Aggregate | | Aggregate | | Aggregate | | | | | | Contributions | | Contributions | | Earnings/(Loss) | | Withdrawals/ | | Balance at | | | | Name | | in Last FY ($)(2) | | in Last FY ($)(3) | | in Last FY ($)(4) | | Distributions ($) | | Last FYE ($) | (5) | | | Marc B. Lautenbach | | | | | | | | | | | | | | | | | | 401(k) Restoration Plan | | — | | | 3,705 | | | 156 | | | 0 | | | 3,861 | | | | Deferred Incentive Savings Plan | | 60,499 | | | — | | | (2,428 | ) | | 0 | | | 58,071 | | | | Michael Monahan | | | | | | | | | | | | | | | | | | 401(k) Restoration Plan | | — | | | 24,782 | | | 10,800 | | | 0 | | | 229,217 | | | | Deferred Incentive Savings Plan | | — | | | — | | | 54,486 | | | 0 | | | 1,219,220 | | | | Mark L. Shearer | | | | | | | | | | | | | | | | | | 401(k) Restoration Plan | | — | | | — | | | — | | | 0 | | | — | | | | Deferred Incentive Savings Plan | | 24,309 | | | — | | | 935 | | | 0 | | | 25,244 | | | | Abby F. Kohnstamm | | | | | | | | | | | | | | | | | | 401(k) Restoration Plan | | — | | | — | | | — | | | 0 | | | — | | | | Deferred Incentive Savings Plan | | — | | | — | | | — | | | 0 | | | — | | | | Daniel J. Goldstein | | | | | | | | | | | | | | | | | | 401(k) Restoration Plan | | — | | | 24,343 | | | 4,063 | | | 0 | | | 80,378 | | | | Deferred Incentive Savings Plan | | — | | | — | | | 7,128 | | | 0 | | | 129,133 | |
| | | (1) | Mr. Lautenbach, Ms. Kohnstamm and Mr. Wright did not incur activity in the nonqualified deferred compensation plans in 2013.2014. | | | | | (2) | Amounts in this column represent the portion of the annual incentives earned in 20122013 and paid in 20132014 deferred under the Deferred Incentive Savings Plan. | | | | | (3) | Amounts shown are company contributions to the Pitney Bowes 401(k) Restoration Plan earned in 20122013 and credited under the 401(k) Restoration Plan in 2013.2014. For Mr. Lautenbach, Mr. Monahan, Ms. Abi-Karam, and Ms. O’Meara,Mr. Goldstein, these amounts are also included in the amended 20122013 All Other Compensation column of the Summary Compensation Table. | | | | | (4) | Amounts shown are the respective earnings or losses in the Pitney Bowes 401(k) Restoration Plan and the Deferred Incentive Savings Plan. These earnings or losses are not included in the Summary Compensation Table. | | | | | (5) | Amounts shown are the respective balances in the Pitney Bowes 401(k) Restoration Plan and the Deferred Incentive Savings Plan. For Mr. Monahan, the Deferred Incentive Savings Plan amount reflects an additional $2,297$87 in dividends relating to 20122013 investment activity that were applied to the beginning balance in 2013.2014. The aggregate balance for the 401(k) Restoration Plan includes amounts previously reported as compensation in the Summary Compensation Table including the amended 2012 and 2011 amounts, as follows: $127,777$3,705 for Mr. Lautenbach, $152,559 for Mr. Monahan, $82,269and $24,343 for Ms. Abi-Karam, and $72,303 for Ms. O’Meara.Mr. Goldstein. The aggregate balance for the Deferred Incentive Savings Plan includes amounts previously reported as compensation in the Summary Compensation Table as follows: $60,499 for Mr. Lautenbach, and $289,800 for Mr. Monahan, and $122,000 for Ms. Abi-Karam.Monahan. |
The material terms of the Pitney Bowes 401(k) Restoration Plan are as follows: | | • | The goal of this plan is generally to restore benefits that would have been provided under the qualified 401(k) Plan but for certain IRC limitations placed on tax-qualified 401(k) plans. | | | | | | | • | For purposes of determining benefits under the 401(k) Restoration Plan, earnings are defined as base salary, vacation, annual incentives (paid and deferred), and certain bonuses. Earnings do not include CIU payments, stock options, restricted stock, performance-based RSUs, performance stock units, severance, hiring bonuses, company contributions to benefits, and expense reimbursements. Participants need to contribute the allowable maximum pre-tax contributions to the 401(k) Plan to be eligible for any company match in the 401(k) Restoration Plan. Once the pre-tax maximum is contributed by the participant into the qualified 401(k) Plan, the company will match the same percentage of eligible compensation that the Participant defers under the 401(k) Plan and the DISP up to a maximum 4% of eligible compensation. | | | | | | | • | In addition, employees not participating in the Pension Plan are eligible to receive a 2% company core contribution into the qualified 401(k) Plan. To the extent the participant has eligible earnings in excess of the IRC compensation limitation, the 2% core contribution is made into the 401(k) Restoration Plan. On January 29, 2013, theThe board of directors approved, effective AprilJanuary 1, 2013 the eligibility of2015, that those employees who will no longer accrue benefits under the Pension Plan because of the Pension Plan freeze, towill participate in the 2% employer core contribution to the 401(k) Plan. See discussion under “Other Indirect Compensation” on page 48 of this proxy statement. |
EXECUTIVE COMPENSATION TABLES AND RELATED NARRATIVE
| | • | Employees must have one year of service to participate, and the vesting is the same as under the qualified 401(k) Plan. Except for Mr. Lautenbach, Ms. Kohnstamm and Mr. Wright, allShearer, the remaining NEOs are fully vested in their accounts. | | | | | | | • | Distributions payable in a lump-sum or installments may occur upon termination of employment and will follow guidelines under IRC 409A. |
The material terms of the Deferred Incentive Savings Plan (DISP) are as follows: The DISP allows deferral of up to 100% of annual incentives and long-term cash incentives. Base salary deferral is permissible only for certain key employees. | • | The DISP allows deferral of up to 100% of annual incentives and long-term cash incentives. Base salary deferral is permissible only for certain key employees.65 |
EXECUTIVE COMPENSATION TABLES AND RELATED NARRATIVE | | • | Employees must be “highly-compensated employees” as defined in the DISP in order to participate in this plan. | | | | | | | • | Distributions from the DISP can occur for various reasons and will be in compliance with guidelines established under IRC 409A:409A |
| | | | | • | Termination/Death/Disability – a lump sum payment is made one month after termination including termination for disability and within 90 days after death | | | | | | | • | Retirement – payment is made in accordance with the payment election in effect for the account beginning after termination | | | | | | | • | Change of Control – payment is made in a lump sum in the event of a termination within two years following a Change of Control | | | | | | | • | Unforeseeable Emergency – plan permits withdrawals with appropriate verification | | | | | | | • | In-Service Payments – payments are made immediately after the deferral dates selected. |
Investment options for both the Pitney Bowes 401(k) Restoration Plan and the DISP are comparable to those in the Pitney Bowes 401(k) Plan. These investment options provide participants with an opportunity to invest in a variety of publicly available bond funds, money market funds, equity funds and blended funds, including Pitney Bowes stock. Each employee notionally selects his or her investment options and can change these at any time by accessing his or her account on the web site of the third party administrator. These investments are tracked in “phantom” accounts. All investment gains and losses in a participant’s account under the Pitney Bowes 401(k) Restoration Plan and the DISP are entirely based upon the notional investment selections made by the participant. Potential Payments upon Termination or Change of Control Other Post-Termination Payments The tables below reflectfollowing table reflects the amount of compensation that would become payable to each of the NEOs under existing arrangements if the hypothetical termination of employment events described had occurred on December 31, 2013,2014, given the NEO’s compensation and service levels as of such date and, if applicable, based on the company’s closing stock price on that date. For purposes of valuing stock options in the “Post-Termination Payments” tables, we assume that upon a Change of Control, all vested outstanding stock options will be cashed out using the difference between the stock option exercise price and $23.30,$24.37, the closing price of our common stock on December 31, 2013.2014. All payments are payable by the company in a lump-sum unless otherwise noted. The actual amounts that would be paid upon a NEO’s termination of employment can be determined only at the time of such executive’s separation from the company. Due to the number of factors that affect the nature and amount of any benefits provided upon the events discussed below, any actual amounts paid or distributed may be higher or lower than reported in the tables below. Factors that could affect these amounts include the timing during the year of any such event, our company’s stock price and the executive’s age. In the event of termination of employment, the NEOs are entitled to receive the vested portion of their deferred compensation account. The account balances continue to be credited with increases or decreases reflecting changes in the value of the investment funds that are tracked until the valuation date as provided under the plan, and therefore amounts received by the NEOs will differ from those shown in the “Nonqualified Deferred Compensation for 2013”2014” table on page 66.65. See the narrative accompanying that table for information on available types of distributions under the plans. The benefits described in the tables belowfollowing table are in addition to benefits available regardless of the occurrence of such an event, such as currently exercisable stock options, and benefits generally available to salaried employees, such as distributions under the company’s 401(k) Plan, subsidized retiree medical benefits, disability benefits, and accrued vacation pay. In addition, in connection with any actual termination of employment, the companyCommittee may determine to enter into an agreement or to establish an arrangement providing additional benefits or amounts, or altering the terms of benefits described in the tables below, as the Committee determines appropriate or in the case of Mr. Lautenbach, the independent board members. EXECUTIVE COMPENSATION TABLES AND RELATED NARRATIVE
After continuing employment with the company through an appropriate transition period, Ms. Abi-Karam separated from the company on September 1, 2013 and was eligible for separation benefits under the Pitney Bowes Separation Pay Plan (Separation Plan). In exchange for Ms. Abi-Karam signing a waiver and release, Ms. Abi-Karam will receive separation pay in an aggregate amount of $1,741,605. In addition, Ms. Abi-Karam was eligible to receive (i) a lump sum payment from the qualified Pension Plan valued at $562,555, (ii) a lump sum payment from the nonqualified Pension Plan valued at $2,408,692 payable in 2014, (iii) accelerated vesting of Ms. Abi-Karam’s outstanding stock options, (iv) accelerated vesting of RSUs, representing 43,634 units, (v) continued vesting of MSUs representing 18,146 units payable in 2015 after the end of the three year award cycle, (vi) pro-rated payment of her CIU awards payable at the end of each respective three-year award cycle, (vii) payment of her nonqualified 401(k) Restoration Plan balance in 2014, (viii) payment of her deferrals under the Deferred Incentive Savings Plan in 2014, (ix) COBRA coverage with the first six months at the active employee rate, (x) outplacement services valued at $25,000, (xi) financial counseling valued at $11,250, (xii) continued company-provided life insurance for one year following separation from employment. Ms. Abi-Karam’s severance period and separation payments ($1,741,605) will count as pensionable earnings through December 31, 2014 under the terms of the qualified Pension Plan and the nonqualified Pension Restoration Plan. Ms. Abi-Karam forfeited her 2013 RSU award upon her separation of employment.
Ms. O’Meara’s employment with the company terminated as a result of the sale of PBMS on September 30, 2013. Ms. O’Meara was not entitled to any severance pay under the company’s plans. As a consequence of the sale, Ms. O’Meara’s RSU and MSU awards vested, with the MSU award payable at the end of the three-year award cycle. Ms. O’Meara’s outstanding CIUs will be pro-rated on the basis of active employment during the award cycle and payable at the end of the award cycle. The buyer assumed the liability for Ms. O’Meara’s 2013 annual incentive.
As noted in footnote 4 to the Summary Compensation Table, Mmes. Abi-Karam and O’Meara were granted performance retention awards which were paid on August 31, 2013 in the amounts of $1,100,000 for Ms. Abi-Karam and $1,000,000 for Ms. O’Meara. These awards were based on the achievement of financial objectives and continued employment through August 31, 2013. The 2010 performance retention awards to Mr. Monahan (paid in 2012) and Mmes. Abi-Karam (paid in 2013) and O’Meara (paid in 2013) were made as part of the board’s succession planning process at a time the board was assessing who would succeed our former CEO.
EXECUTIVE COMPENSATION TABLES AND RELATED NARRATIVE Estimated Post-Termination Payments and Benefits(1)
| Name | | Type of Payment or Benefit | | Retirement
Eligible ($) | | Involuntary Not for
Cause Termination ($)(2) | | Change of
Control with
Termination
(CIC) ($) | | Death ($) | | Disability ($) | | | Marc B. Lautenbach | | Severance | | — | | 32,692 - 2,932,500 | (3) | 2,932,500 | (4) | — | | — | | | | | Annual Incentive | | — | | 0 - 1,105,000 | (5) | 1,105,000 | (6) | 1,209,975 | (7) | 1,209,975 | (7) | | | | CIUs | | | | | | | | | | | | | | | 2013 – 2015 cycle | | — | | 0 | (8) | 2,400,000 | (9) | 800,000 | (8) | 800,000 | (8) | | | | Stock Options Accelerated(10) | | — | | 2,275,800 | | 3,755,700 | | 3,755,700 | | 3,755,700 | | | | | Performance-based RSUs Accelerated(11) | | — | | 0 | | 2,691,686 | | 2,691,686 | | 2,691,686 | | | | | Financial Counseling(12) | | — | | 0 - 11,250 | | — | | — | | — | | | | | Medical & other benefits(13) | | — | | — | | 85,935 | | | | | | | | | Total | | 0 | | 2,308,492 - 6,324,550 | | 12,970,821 | | 8,457,361 | | 8,457,361 | | | Michael Monahan | | Severance | | — | | 22,246 - 1,561,680 | (3) | 1,973,197 | (4) | — | | — | | | | | Annual Incentive | | — | | 0 - 462,720 | (5) | 462,720 | (6) | 506,678 | (7) | 506,678 | (7) | | | | CIUs | | — | | | | | | | | | | | | | 2011 – 2013 cycle | | — | | 0 - 975,000 | (14) | 975,000 | (9) | 975,000 | (14) | 975,000 | (14) | | | | 2012 – 2014 cycle | | — | | 0 - 433,333 | (8) | 650,000 | (9) | 433,333 | (8) | 433,333 | (8) | | | | 2013 – 2015 cycle | | — | | 260,000 | (8) | 780,000 | (9) | 260,000 | (8) | 260,000 | (8) | | | | Stock Options Accelerated(10) | | — | | 0 | | 745,200 | | 745,200 | | 745,200 | | | | | Performance-based RSUs Accelerated(11) | | — | | 0 - 1,406,458 | | 1,406,458 | | 1,406,458 | | 1,406,458 | | | | | Performance-based MSUs Accelerated(11) | | — | | 0 - 422,802 | | 422,802 | | 422,802 | | 422,802 | | | | | Incremental Pension Benefit | | — | | 0 - 200,348 | (15) | 118,837 | (15) | — | | — | | | | | Financial Counseling(12) | | — | | 0 - 11,250 | | — | | — | | — | | | | | Medical & other benefits(13) | | — | | — | | 88,606 | | — | | — | | | | | Total | | 0 | | 282,246 - 5,733,591 | | 7,622,820 | | 4,749,471 | | 4,749,471 | | | Abby F. Kohnstamm | | Severance | | — | | 21,538 - 1,512,000 | (3) | 2,016,000 | (4) | — | | — | | | | | Annual Incentive | | — | | 0 - 264,768 | (5) | 448,000 | (6) | 264,768 | (7) | 264,768 | (7) | | | | Performance-based RSUs Accelerated(11) | | — | | 0 - 0 | | 622,995 | | 622,995 | | 622,995 | | | | | Financial Counseling(12) | | — | | 0 - 11,250 | | — | | — | | — | | | | | Medical & other benefits(13) | | — | | — | | 56,524 | | — | | — | | | | | Total | | 0 | | 21,538 - 1,788,018 | | 3,143,519 | | 887,763 | | 887,763 | | | Mark F. Wright | | Severance | | — | | 19,231 - 1,200,000 | (3) | 1,600,000 | (4) | — | | — | | | | | Annual Incentive | | — | | 0 - 300,000 | (5) | 300,000 | (6) | 328,500 | (7) | 328,500 | (7) | | | | CIUs | | — | | | | | | | | | | | | | 2013 – 2015 cycle | | — | | 0 | (8) | 450,000 | (9) | 150,000 | (8) | 150,000 | (8) | | | | Performance-based RSUs Accelerated(11) | | — | | 0 | | 815,826 | | 815,826 | | 815,826 | | | | | Financial Counseling(12) | | — | | 0 - 11,250 | | — | | — | | — | | | | | Medical & other benefits(13) | | — | | — | | 73,432 | | — | | — | | | | | Total | | 0 | | 19,231 - 1,511,250 | | 3,239,258 | | 1,294,326 | | 1,294,326 | | | Daniel J. Goldstein | | Severance | | — | | 18,362 - 1,145,760 | (3) | 1,156,655 | (4) | — | | — | | | | | Annual Incentive | | — | | 0 - 286,440 | (5) | 286,440 | (6) | 313,652 | (7) | 313,652 | (7) | | | | CIUs | | — | | | | | | | | | | | | | 2011 – 2013 cycle | | — | | 0 - 412,500 | (14) | 412,500 | (9) | 412,500 | (14) | 412,500 | (14) | | | | 2012 – 2014 cycle | | — | | 0 - 216,667 | (8) | 325,000 | (9) | 216,667 | (8) | 216,667 | (8) | | | | 2013 – 2015 cycle | | — | | 0 | (8) | 390,000 | (9) | 130,000 | (8) | 130,000 | (8) | | | | Stock Options Accelerated(10) | | — | | 0 | | 0 | | 0 | | 0 | | | | | Performance-based RSUs Accelerated(11) | | — | | 0 - 271,958 | | 760,582 | | 760,582 | | 760,582 | | | | | Performance-based MSUs Accelerated(11) | | — | | 0 - 211,401 | | 211,401 | | 211,401 | | 211,401 | | | | | Incremental Pension Benefit | | — | | — | (15) | — | (15) | — | | — | | | | | Financial Counseling(12) | | — | | 0 - 11,250 | | — | | — | | — | | | | | Medical & other benefits(13) | | — | | — | | 56,506 | | — | | — | | | | | Total | | 0 | | 18,362 - 2,555,976 | | 3,599,084 | | 2,044,802 | | 2,044,802 | |
| | | | | | | | | | | Change of | | | | | | | | | | | | | | | | | | | Control with | | | | | | | | | | | | | Retirement | | | Involuntary Not for | | | Termination | | | | | | | | | Name | | Type of Payment or Benefit | | Eligible ($) | | | Cause Termination ($)(2) | | | (CIC) ($) | | | Death ($) | | | Disability ($) | | | Marc B. Lautenbach | | Severance | | | — | | | | 34,615 - 3,172,500 | (3) | | | 4,230,000 | (4) | | | — | | | | — | | | | | Annual Incentive | | | — | | | | 0 - 1,215,000 | (5) | | | 1,215,000 | (6) | | | 1,519,965 | (7) | | | 1,519,965 | (7) | | | | CIUs | | | | | | | | | | | | | | | | | | | | | | | | 2013 – 2015 cycle | | | — | | | | 0 - 1,600,000 | (8) | | | 2,400,000 | (9) | | | 1,600,000 | (8) | | | 1,600,000 | (8) | | | | Stock Options Accelerated(10) | | | — | | | | 0 - 3,038,800 | | | | 3,038,800 | | | | 3,038,800 | | | | 3,038,800 | | | | | Performance-based RSUs Accelerated(11) | | | — | | | | 0 - 1,407,636 | | | | 3,423,766 | | | | 3,423,766 | | | | 3,423,766 | | | | | Performance Stock Units | | | | | | | | | | | | | | | | | | | | | | | | 2014 – 2016 cycle | | | — | | | | 0 | (12) | | | 3,057,168 | (13) | | | 1,019,056 | (12) | | | 1,019,056 | (12) | | | | Financial Counseling(14) | | | — | | | | 0 - 11,250 | | | | — | | | | — | | | | — | | | | | Medical & other benefits(15) | | | — | | | | — | | | | 78,298 | | | | | | | | | | | | | Total | | | 0 | | | | 34,615 - 10,445,186 | | | | 17,443,032 | | | | 10,601,587 | | | | 10,601,587 | | | Michael Monahan | | Severance | | | — | | | | 23,358 - 1,639,764 | (3) | | | 2,043,382 | (4) | | | — | | | | — | | | | | Annual Incentive | | | — | | | | 485,856 | (5) | | | 485,856 | (6) | | | 607,806 | (7) | | | 607,806 | (7) | | | | CIUs | | | | | | | | | | | | | | | | | | | | | | | | 2012 – 2014 cycle | | | — | | | | 864,500 | (16) | | | 864,500 | (9) | | | 864,500 | (16) | | | 864,500 | (16) | | | | 2013 – 2015 cycle | | | — | | | | 520,000 | (8) | | | 780,000 | (9) | | | 520,000 | (8) | | | 520,000 | (8) | | | | Stock Options Accelerated(10) | | | — | | | | 713,860 | | | | 1,070,800 | | | | 1,070,800 | | | | 1,070,800 | | | | | Performance-based RSUs Accelerated(11) | | | — | | | | 976,457 | | | | 1,355,557 | | | | 1,355,557 | | | | 1,355,557 | | | | | Performance-based MSUs Accelerated(11) | | | — | | | | 442,218 | | | | 442,218 | | | | 442,218 | | | | 442,218 | | | | | Performance Stock Units | | | | | | | | | | | | | | | | | | | | | | | | 2014 – 2016 cycle | | | — | | | | 294,398 | (12) | | | 883,193 | (13) | | | 294,398 | (12) | | | 294,398 | (12) | | | | Incremental Pension Benefit | | | — | | | | 0 | (17) | | | 0 | (17) | | | — | | | | — | | | | | Financial Counseling(14) | | | — | | | | 11,250 | | | | — | | | | — | | | | — | | | | | Medical & other benefits(15) | | | — | | | | — | | | | 79,340 | | | | — | | | | — | | | | | Total | | | 0 | | | | 4,331,897 - 5,948,303 | | | | 8,004,846 | | | | 5,155,279 | | | | 5,155,279 | | | Mark L. Shearer | | Severance | | | — | | | | 21,987 - 1,543,455 | (3) | | | 2,115,660 | (4) | | | — | | | | — | | | | | Annual Incentive | | | — | | | | 0 - 457,320 | (5) | | | 457,320 | (6) | | | 572,107 | (7) | | | 572,107 | (7) | | | | CIUs | | | | | | | | | | | | | | | | | | | | | | | | 2013 – 2015 cycle | | | — | | | | 0 - 520,000 | (8) | | | 780,000 | (9) | | | 520,000 | (8) | | | 520,000 | (8) | | | | Performance-based RSUs Accelerated(11) | | | — | | | | 0 - 443,705 | | | | 1,044,669 | | | | 1,044,669 | | | | 1,044,669 | | | | | Performance Stock Units | | | | | | | | | | | | | | | | | | | | | | | | 2014 – 2016 cycle | | | — | | | | 0 | (12) | | | 883,193 | (13) | | | 294,398 | (12) | | | 294,398 | (12) | | | | Financial Counseling(14) | | | — | | | | 0 - 11,250 | | | | — | | | | — | | | | — | | | | | Medical & other benefits(15) | | | — | | | | 0 | | | | 61,040 | | | | — | | | | — | | | | | Total | | | 0 | | | | 21,987 - 2,975,730 | | | | 5,341,882 | | | | 2,431,174 | | | | 2,431,174 | | | Abby F. Kohnstamm | | Severance | | | — | | | | 21,538 - 1,512,000 | (3) | | | 2,102,644 | (4) | | | — | | | | — | | | | | Annual Incentive | | | — | | | | 0 - 448,000 | (5) | | | 448,000 | (6) | | | 560,448 | (7) | | | 560,448 | (7) | | | | Performance-based RSUs Accelerated(11) | | | — | | | | 0 | | | | 534,629 | | | | 534,629 | | | | 534,629 | | | | | Performance Stock Units | | | | | | | | | | | | | | | | | | | | | | | | 2014 – 2016 cycle | | | — | | | | 0 | (12) | | | 339,693 | (13) | | | 113,231 | (12) | | | 113,231 | (12) | | | | Financial Counseling(14) | | | — | | | | 0 - 11,250 | | | | — | | | | — | | | | — | | | | | Medical & other benefits(15) | | | — | | | | — | | | | 50,888 | | | | — | | | | — | | | | | Total | | | 0 | | | | 21,538 - 1,971,250 | | | | 3,475,854 | | | | 1,208,308 | | | | 1,208,308 | | | Daniel J. Goldstein | | Severance | | | — | | | | 18,912 - 1,180,133 | (3) | | | 1,131,177 | (4) | | | — | | | | — | | | | | Annual Incentive | | | — | | | | 295,033 | (5) | | | 295,033 | (6) | | | 369,087 | (7) | | | 369,087 | (7) | | | | CIUs | | | | | | | | | | | | | | | | | | | | | | | | 2012 – 2014 cycle | | | — | | | | 432,250 | (16) | | | 432,250 | (9) | | | 432,250 | (16) | | | 432,250 | (16) | | | | 2013 – 2015 cycle | | | — | | | | 260,000 | (8) | | | 390,000 | (9) | | | 260,000 | (8) | | | 260,000 | (8) | | | | Stock Options Accelerated(10) | | | — | | | | 0 | | | | 0 | | | | 0 | | | | 0 | | | | | Performance-based RSUs Accelerated(11) | | | — | | | | 368,011 | | | | 671,930 | | | | 671,930 | | | | 671,930 | | | | | Performance-based MSUs Accelerated(11) | | | — | | | | 221,109 | | | | 221,109 | | | | 221,109 | | | | 221,109 | | | | | Performance Stock Units | | | | | | | | | | | | | | | | | | | | | | | | 2014 – 2016 cycle | | | — | | | | 147,195 | (12) | | | 441,584 | (13) | | | 147,195 | (12) | | | 147,195 | (12) | | | | Incremental Pension Benefit | | | — | | | | 7,348 | (17) | | | 0 | (17) | | | — | | | | — | | | | | Financial Counseling(14) | | | — | | | | 11,250 | | | | — | | | | — | | | | — | | | | | Medical & other benefits(15) | | | — | | | | — | | | | 50,988 | | | | — | | | | — | | | | | Total | | | 0 | | | | 1,761,109 - 2,922,329 | | | | 3,634,071 | | | | 2,101,571 | | | | 2,101,571 | |
| (1) | All data is shown assuming termination on December 31, 2013.2014. | | | | (2) | Ranges represent variance between the NEO’sNEOs basic severance plan and enhanced severance payment as explained in the section entitled “Explanation of Benefits Payable Upon Various Termination Events” on page 7169 of this Proxy Statement. | | | | (3) | If termination of employment falls within the terms of the Pitney Bowes Severance Pay Plan, the NEOsnamed executive officers would receive a minimum of 2 weeks of base salary if they were terminated involuntarily and not for cause. Under our enhanced severance policy, the NEOs could receive up to 78 weeks of base salary (inclusive of the 2 weeks) plus target bonus contingent upon signing a waiver and release. |
EXECUTIVE COMPENSATION TABLES AND RELATED NARRATIVE | (4) | In October 2012, Pitney Bowes’ SESP was amendedThe company does not apply a tax gross-up on any Change of Control payments. The “best-net” approach is applied to eliminate excise tax gross-ups. Executives now receive payments calculated based on a “best-net” approach. For Mr. Monahan, Mr. Wright, Mr. Goldstein, and Ms. Kohnstamm,Change of Control payments. Under this approach, the amount representspaid is either (i) the full value of the payment equal to two times the sum of the participant’sparticipant's current annual salary and the participant’sparticipant's average annual incentive award forin the preceding three years, or (ii) the value of the payment that is capped at the 280G limit, depending on which provides the higher after-tax benefit. Forbenefit to the executive. Since Mr. Goldstein, the 2010 annual incentive paid in 2011 is annualized to account for a break in service prior to his being rehired in October 2010. SinceLautenbach, Mr. Shearer, and Ms. Kohnstamm and Mr. Wright were hired in 2013, their average annual incentive used in calculating their Change of Control benefit is based on target instead of actual incentive payouts. For Mr. Lautenbach, if during his first 18 months of employment, there is a Change of Control and he resigns for good reason within the subsequent two years, he will receive either the full value of the payment equal to 1.5 times the sum of his current annual salary and current target bonus, or the value of the payment that is capped at the 280G limit, depending on which provides the higher after-tax benefit. |
EXECUTIVE COMPENSATION TABLES AND RELATED NARRATIVE
| (5) | A pro-ratedprorated annual incentive is paid at the lower of target or current bonus accrual as additional severance at termination contingent upon signing a waiver and release. If a waiver and release is not signed, no severance is paid in excess of two weeks. For Ms. Kohnstamm, annual incentive is pro-rated based on her start date of June 17, 2013. | | | | (6) | Annual incentive is valued at the targeted amount and is paid upon termination following a Changechange of Control. | | control. | | (7) | A pro-ratedprorated annual incentive is paid at the actual amount earned for 20132014 at the time of the normal distribution of annual incentives. For Ms. Kohnstamm, annual incentive is pro-rated based on her start date of June 17, 2013. | | | | (8) | CIUs for 2012 – 2014 andthe 2013 – 2015 cyclescycle are estimated at the targeted amount which is $1.00 per unit. Payment is pro-ratedprorated based upon time worked through the end of each cycle. However, payment is not made until the end of the performance period and will be paid based on actual results. In the case of involuntary not for cause termination, no payments are made for theThe 2013 – 2015 CIU cycle since the award has been outstanding for less than one year, except if the executive has attained early retirement eligibility or is bridgeable to early retirement, then payment is pro-rated based upon time worked through the end of the cycle. The 2012 – 2014 cycle payment is subject to signing a waiver and release. | | | | (9) | CIUs for 20112012 – 20132014 cycles are valued at $1.50$1.33 per unit and paid in February 20142015 under the normal distribution of CIUs. CIUs for 2012 – 2014 andthe 2013 – 2015 cycles–2015 cycle are valued at the targeted amount which is $1.00 per unit. | | | | (10) | In casesthe case of retirement, options outstanding for at least one year will immediately vest and remain exercisable for the balance of the option term. In casesthe case of involuntary not for cause termination, options outstanding for at least one year will continue to vest and remain exercisable for 24 months following termination of employment contingent upon signing a waiver and release. In casesthe case of retirement or involuntary not for cause termination, options outstanding for less than one year forfeit. In the cases of Changechange of Control,control, death and disability, all outstanding options will immediately vest and remain exercisable for the balance of the option term. | | | | (11) | In the case of involuntary not for cause termination accompanied by a separation agreement including a waiver and release, all performance-based RSUs and MSUs outstanding for one year or more at the date of termination will continue to vest up to 24 months following termination, except if the executive has attained retirement eligibility or is bridgeable to early retirement, then all performance-based RSUs outstanding for one year will eventually vest. For Mr. Monahan and Mr. Goldstein, in the case of Changechange of Controlcontrol followed by termination of employment, all performance-based MSUs vest immediately with shares issued immediately at target. All restrictions on performance-based RSUs and MSUs lapse immediately upon death, disability, or Changechange of Controlcontrol followed by termination of employment. | | (12) | PSUs for the 2014 – 2016 cycle are estimated based on the target number of shares granted. Vesting is prorated based upon time worked through the end of each cycle. However, payment does not occur until the end of the performance period and will be based on actual results. In the case of involuntary not for cause termination, no vesting occurs for the 2014 – 2016 PSU cycle until the award has been outstanding for more than one year, except if the executive has attained early retirement eligibility or is bridgeable to early retirement, then vesting is prorated based upon time worked through the end of the cycle. | (12)(13) | PSUs for the 2014 – 2016 cycle are valued based on the target number of shares granted. | | (14) | Amount shown is the value of the company’scompany's cost to provide financial counseling through the severance period, during which NEOsexecutive officers may receive for up to a maximum of 78 weeks. | | weeks of financial counseling. | (13)(15) | Amount shown is the present value of the company’scompany's cost to continue medical and other health and welfare plans for three years plus the company’scompany's cost for outplacement services. | | | (14)(16) | CIUs for 2011the 2012 – 2013 cycles2014 cycle are valued at $1.50$1.33 per unit based upon actual achievement of performance metrics for the 20112012 – 20132014 cycle. In the case of involuntary not for cause termination, payment of this amount is subject to signing a waiver and release. If the executive has attained early retirement eligibility or is bridgeable to early retirement, then vesting is prorated based upon time worked through the end of the cycle. This amount was paid in February 20142015 under the normal distribution of CIUs. | | | (15)(17) | Amount shown is the increase in lump-sum actuarial equivalent of the pension age, service and earnings credits for the associated severance period. Mr. Lautenbach, Mr. Wright, and Ms. Kohnstamm and Mr. Shearer are not Pension Planpension plan participants. Mr. Goldstein is not currently participating in the Pension Plan,pension plan, but has a prior accumulated benefit under the plans. In the case of a Change inof Control with termination, amount shown is the increase in lump-sum actuarial equivalent of the pension age and service credits for the associated severance period. |
EXECUTIVE COMPENSATION TABLES AND RELATED NARRATIVE Explanation of Benefits Payable upon Various Termination Events The benefits described below apply to the NEOs. Resignation A voluntary termination would not provide any compensation, benefits or special treatment under equity plans for any of the NEOs. Early and Normal Retirement The U.S. Pitney Bowes Pension Plan allows for early retirement at age 55 with at least ten years of service, and normal retirement at age 65 with at least three years of service. EarlyThe early and normal retirement entitlesrules established under the Pension Plan are also utilized under the long-term incentive plan and stock plan for special vesting purposes. NEOs meeting the requirements specified for early or normal retirement are entitled to the following upon termination: | | • | A prorated annual incentive award; | | | • | Prorated PSU vesting at the end of each three-year cycle; | | | • | Prorated CIU payments paid at the end of each three-year cycle; | | | | | | • | Stock option awards and RSUs that have been outstanding for at least one year will fully vest upon retirement and stock options will remain exercisable for the duration of the term; | | | | | | • | MSUs that have been outstanding for at least one year will fully vest with units converted into stock at the end of the three-year vesting period based on TSR. |
Ms. Abi-Karam terminated employment September 1, 2013 and was bridged to her early retirement date, November 14, 2013.
Involuntary/Not for Cause Termination – Severance Pay Plan We maintain a severance pay plan that provides for the payment of severance to full-time employees based in the United States whose employment is terminated under certain business circumstances (other than a Change of Control). The Pitney Bowes Severance Pay Plan provides a continuation of compensation upon involuntary termination by the company without cause as summarized below. In addition, in order to obtain an appropriate waiver and release from the employee, we may offer conditional severance payments. Where an employee is involuntarily terminated after becoming eligible for early retirement, the employee is eligible for benefits afforded early retirees or involuntarily terminated employees, whichever is greater. Severance Pay Plan
The Severance Pay Plan provides for one week of salary continuation benefits per year of service. Salary continuation benefits in excess of two weeks of salary require a signed agreement containing a waiver and release. There is a two week minimum benefit under the Severance Pay Plan. Conditional Severance
We may offer additional severance to employees, including NEOs, upon termination of employment, conditioned upon signing a waiver and release. Additional severance could include the following payments: | | • | Severance pay is based on years of service and level within the company. All NEOs are eligible for up to 78 weeks of pay including current base salary plus current target annual incentive; | | | | | | • | A prorated annual incentive award to the date of termination of employment; | | | • | PSUs outstanding for one year from the date of grant are prorated and vesting occurs at the end of each three-year cycle; | | | • | CIUs outstanding for one year from the date of grant are prorated and payments are calculated and paid at the end of each three-year cycle; | | | | | | • | For NEOs, stock options, RSUs and MSUs outstanding for one year at the date of termination will continue to vest up to 24 months following termination and will expire at the end of this period; | | | | | | • | The board of directors has the discretion to accelerate vesting of restricted stock, RSUs, PSUs and MSUs that would otherwise be forfeited; | | | | | | • | Pension benefit calculation includes service credit and earnings during the severance period; | | | | | | • | Financial counseling through the severance period; and | | | | | | • | Outplacement services. |
EXECUTIVE COMPENSATION TABLES AND RELATED NARRATIVE Termination for Cause Termination for cause would not provide any additional compensation, severance, benefits or special treatment under equity plans to any of the NEOs. “Cause” is defined as willful failure to perform duties or engaging in illegal conduct or gross misconduct harmful to the company. EXECUTIVE COMPENSATION TABLES AND RELATED NARRATIVE
Death The NEO’s beneficiary would be entitled to the following upon the executive’s death: | | • | A prorated annual incentive award; | | | | | | • | CIU paymentsPSUs are prorated through the date of death and paidvested, valued and converted into stock at the end of each three-year cycle; | | | • | CIU payments are prorated through the date of death and vested, valued and paid at the end of each three-year cycle; | | | • | All stock options will vest upon death. The NEO’s beneficiary can exercise stock options during the remaining term of the grant; | | | | | | • | Restrictions on outstanding shares of restricted stock and RSUs will be removed; | | | | | | • | MSUs will fully vest with unitsare vested, valued and converted into stock at the end of the three-year vesting period based on TSRupon death. |
Disability Disability vesting occurs after the completion of two years of long-term disability or on the date of termination of employment due to disability, whichever is earlier. The NEOs would be entitled to the following upon termination for disability: | | • | A prorated annual incentive award; | | | | | | • | Prorated CIU payments madePSU are prorated through the date of disability and vested, valued and converted into stock at the end of each three-year cycle; | | | • | CIU payments are prorated through the date of disability and vested, valued and paid at the end of each three-year cycle; | | | • | All stock options and RSUs will vest upon disability vesting date.date (two years after the onset of LTD). Stock options can be exercised during the remaining term of the grant; | | | | | | • | Restrictions on outstanding shares of restricted stock and RSUs will be removed; | | | | | • | MSUs will fully vest with unitsare vested, valued and converted into stock at the end of the three-year vesting period based on TSRupon termination for disability. |
Change of Control Arrangements Set forth below is a summary of our Change of Control arrangements. Under our Change of Control arrangements, a “Change of Control” is defined as: | | • | In December 2012, the board of directors approved a change in the definition of Change of Control dealing with the acquisition of company shares. Under the new definition, a Change of Control would occur if there is an acquisition of 30% (previously 20%) or more of our common stock or 30% (previously 20%) or more of the combined voting power of our voting securities by an individual, entity or group; | | | | | | • | the replacement of a majority of the board of directors other than by approval of the incumbent board; | | | | | | • | the consummation of a reorganization, merger, or consolidation where greater than 50% of our common stock and voting power changes hands; or | | | | | | • | the approval by stockholders of the liquidation or dissolution of the company. |
In October 2012, the board of directors amended the Pitney Bowes SESP to eliminatedoes not gross-up the excise tax gross-ups.applicable to change of control payments. Upon a termination from employment without cause or for good reason (defined as a diminution in position, authority, duties, responsibilities, earnings or benefits, or relocation) within two years of a Change of Control each of the NEOs receive payments calculated based on a “best-net” approach as it relates to the benefits described below.
| | • | Either (i) the full value of the payment equal to two times the sum of the participant’s current annual salary and the participant’s average annual incentive award in the preceding three years, or (ii) the value of the payment that is capped at the 280G limit, depending on which provides the higher after-tax benefit. (Effective February 11, 2013, the board of directors reduced the severance benefit payable to NEOs upon a termination from employment on account of a Change of Control from three years base and bonus to two years base and bonus); | | | | | • | During the first 18 months of employment, Mr. Lautenbach is entitled to one and one-half times current base salary and target bonus. Bonus will be payable in a lump sum. After 18 months of employment, upon a “Change of Control” or resignation for “Good Reason” within two years subsequent to a “Change of Control” Mr. Lautenbach would receive two times current base salary and current target bonus. Bonus will be payable in a lump sum; | | | | | | • | A prorated annual incentive award based on the participant’s current annual incentive target; | | | • | PSU vesting based on the total of the outstanding grants for each of the open cycles at target number of shares at the end of the cycle, or upon termination, if earlier; | | | • | CIU payments based on the total of the outstanding grants for each of the open cycles paid at target value at the end of the cycle, or upon termination, if earlier; | | | | | | • | All stock options, restricted stock, RSUs and MSUs granted under the 2007 and 2013Stock Plan will vest upon the employee’s termination and stock options can be exercised during their remaining term; |
EXECUTIVE COMPENSATION TABLES AND RELATED NARRATIVE | | • | Only age and service credits are included in the pension calculation for the associated severance period; effective with the freezing of the Pension Plan on December 31, 2014, no further age and service credits are included in Change of Control severance. |
EXECUTIVE COMPENSATION TABLES AND RELATED NARRATIVE
| | • | Health and welfare benefits for the executive and his or her dependents for a three-year period. Effective February 11, 2013, health and welfare benefits for the executive and his or her dependents will be provided for a two-year period; and | | | | | | • | Outplacement services. |
Internal Revenue Code Section 409A Our benefits arrangements are intended to comply with IRC 409A. In that regard, “Key Employees” as defined in IRC 409A and IRC 416 may have certain payments delayed until six months after termination of employment. Additional Information Solicitation of Proxies In addition to the use of the mail, proxies may be solicited by the directors, officers, and employees of the company without additional compensation by personal interview, by telephone, or by electronic transmission. Arrangements may also be made with brokerage firms and other custodians, nominees, and fiduciaries for the forwarding of solicitation material to the beneficial owners of Pitney Bowes common stock and $2.12 convertible preference stock held of record, and the company will reimburse such brokers, custodians, nominees, and fiduciaries for reasonable out-of-pocket expenses incurred. The company has retained Morrow & Co., LLC to aid in the solicitation of proxies. The anticipated fee of such firm is $10,000 plus out-of-pocket costs and expenses. The cost of solicitation will be borne entirely by Pitney Bowes. Other Matters Management knows of no other matters which may be presented for consideration at the meeting. However, if any other matters properly come before the meeting, it is the intention of the individuals named in the enclosed proxy to vote in accordance with their judgment. By order of the board of directors. Amy C. Corn
Corporate Secretary
[

This Page Intentionally Left Blank]proxy statement is printed entirely on recycled and recyclable paper. ANNEX A
PITNEY BOWES INC. DIRECTORS’ STOCK PLAN
Amended and Restated Effective as of May 12, 2014
Section 1.Purpose and Effective Date of Plan.
This Plan shall be known as the Pitney Bowes Inc. Directors’ Stock Plan. The purpose of the Plan is to enable Pitney Bowes Inc. (the “Company”) to attract and retain persons of outstanding competence to serve as non-employee directors of the Company by paying such persons a portion of their compensation in stock of the Company pursuant to the terms of the Plan. The Plan became effective on the date the Plan was initially approved by the stockholders of the Company. The Plan may be amended from time to time and was amended and restated effective as of May 12, 2014.
Section 2.Stock Available for the Plan.
Awards granted under the Plan will be settled by the issuance of shares of Common Stock, $1 par value per share, of the Company (“Common Stock”), that are drawn from the shares of Common Stock available for issuance from time to time under the Pitney Bowes Inc. 2013 Stock Plan (the “2013 Stock Plan”), previously approved by the Company’s stockholders, or a successor stockholder-approved equity compensation plan. Shares of Common Stock issued pursuant to awards of restricted stock units under the Plan shall reduce, on a one-for-one basis, both (a) the overall maximum number of shares of Common Stock available for issuance under the 2013 Stock Plan and (b) the sub-limit under the 2013 Stock Plan for the number of shares that may be issued for awards that are not options or stock appreciation rights.
Section 3.Eligibility for Participation in Plan.
Persons who serve as members of the board of directors of the Company (the “Board”) and who are not “employees” of the Company or its subsidiaries within the meaning of the Employee Retirement Income Security Act of 1974, as amended (“ERISA”) shall be considered “Eligible Directors” for purposes of the Plan. It is intended that all Eligible Directors participate in the Plan.
Section 4.Awards of Restricted Stock Units.
(a) | Each Eligible Director then serving as a director of the Company shall receive an annual award on the date of the first meeting of directors after each annual stockholders’ meeting of restricted stock units with respect to a number of shares of Common Stock having a Fair Market Value (as defined herein) equal to $100,000. For purposes of this Plan, the Fair Market Value of a share of Company Common Stock on the date of grant shall be the closing price of a share of Company Common Stock on the date of grant as reported in the New York Stock Exchange Composite Transactions Table published in the Wall Street Journal. If the New York Stock Exchange (NYSE) is closed on the date of grant, then Fair Market Value shall be the closing price on the first trading day of the NYSE immediately following the grant date. An Eligible Director who joins the Board after such date shall receive a partial award of restricted stock units with respect to a number of shares of Common Stock having a Fair Market Value on the date of grant equal to a prorated amount determined by multiplying $100,000 by a fraction the numerator of which is the number of days remaining in the 12 month period beginning on the date following the annual stockholders’ meeting and the denominator of which is 365. Fractional shares shall not be issued to Eligible Directors. A whole number of shares shall be determined by rounding each fractional share to the next highest whole number. | | | (b) | Each restricted stock unit granted under the Plan shall represent the right to receive one share of Common Stock on the date that is one year following the date the award is granted; provided, however, that with respect to each annual grant the Company may, in its sole discretion, provide Eligible Directors with the one-time opportunity to elect to defer the settlement of the restricted stock units until the termination of the Eligible Director’s service as a director of the Company. The terms and conditions of any such deferral election are intended to be implemented in a manner consistent with the requirements of Section 409A of the Internal Revenue Code of 1986, as amended. |
Section 5.Dividends; Transfer Restrictions; Terms and Conditions of Restricted Stock Units.
(a) | Unless the Administrator (as defined herein) determines otherwise, Eligible Directors shall have the right to receive dividend equivalents in connection with the restricted stock units granted hereunder pursuant to which the Eligible Directors shall be entitled to receive payments equivalent to dividends with respect to the number of shares subject to the corresponding award of restricted stock units, which payments, unless the Administrator determines otherwise, shall be paid to the applicable Eligible Directors in cash as and when such dividends are |
| paid to the holders of Common Stock. Unless the Administrator determines otherwise, other than the rights to dividend equivalents, Eligible Directors shall have no voting or other rights as a stockholder with respect to the shares of Common Stock subject to and/or issuable pursuant to any awards of restricted stock units granted hereunder until such shares are actually issued to the Eligible Director and are registered in his or her name. | | | (b) | The restricted stock units granted hereunder may not be sold, assigned, pledged or otherwise transferred by the Eligible Director, other than by will or the laws of descent and distribution. In addition, subject to Section 5(d), the shares of Common Stock subject to any restricted stock units granted hereunder may not be sold, assigned, pledged or otherwise transferred by the Eligible Director unless and until such shares are issued to the Eligible Director free and clear of all transfer restrictions imposed by this Plan or otherwise. | | | (c) | Notwithstanding any other provision of this Plan, the issuance or delivery of any shares hereunder may be postponed for such period as may be required to comply with any applicable requirements of any national securities exchange or any requirements under any other law or regulation applicable to the issuance or delivery of such shares, and the Company shall not be obligated to issue or deliver any such shares if the issuance or delivery thereof shall constitute a violation of any provision of any law or of any regulation of any governmental authority or any national securities exchange. |
Section 6.[reserved]
Section 7.Change of Control.
For purposes of this Plan, a “Change of Control” shall be deemed to have occurred if:
(i) | there is an acquisition, in any one transaction or a series of transactions, other than from Pitney Bowes Inc., by any individual, entity or group (within the meaning of Section 13(d)(3) or 14(d)(2) of the Securities Exchange Act of 1934, as amended (the “Exchange Act”)), of beneficial ownership (within the meaning of Rule 13(d)(3) promulgated under the Exchange Act) of 30% or more of either the then outstanding shares of Common Stock or the combined voting power of the then outstanding voting securities of Pitney Bowes Inc. entitled to vote generally in the election of directors, but excluding, for this purpose, any such acquisition by Pitney Bowes Inc. or any of its subsidiaries, or any employee benefit plan (or related trust) of Pitney Bowes Inc. or its subsidiaries, or any corporation with respect to which, following such acquisition, more than 50% of the then outstanding shares of common stock of such corporation and the combined voting power of the then outstanding voting securities of such corporation entitled to vote generally in the election of directors is then beneficially owned, directly or indirectly, by the individuals and entities who were the beneficial owners, respectively, of the common stock and voting securities of Pitney Bowes Inc. immediately prior to such acquisition in substantially the same proportion as their ownership, immediately prior to such acquisition, of the then outstanding shares of Common Stock or the combined voting power of the then outstanding voting securities of Pitney Bowes Inc. entitled to vote generally in the election of directors, as the case may be; or | | | (ii) | individuals who, as of May 12, 2014, constitute the Board (as of such date, the “Incumbent Board”) cease for any reason to constitute at least a majority of the Board, provided that any individual becoming a director subsequent to September 9, 1996, whose election, or nomination for election by Pitney Bowes’ shareholders, was approved by a vote of at least a majority of the directors then comprising the Incumbent Board shall be considered as though such individual were a member of the Incumbent Board, but excluding, for this purpose, any such individual whose initial assumption of office is in connection with an actual or threatened election contest relating to the election of the directors of Pitney Bowes Inc. (as such terms are used in Rule 14(a)(11) of Regulation 14A promulgated under the Exchange Act); or | | | (iii) | there occurs either (A) the consummation of a reorganization, merger, consolidation, or sale or other disposition of all or substantially all of the assets of the Company, in each case, with respect to which the individuals and entities who were the respective beneficial owners of the common stock and voting securities of Pitney Bowes Inc. immediately prior to such reorganization, merger, consolidation or sale or other disposition do not, following such reorganization, merger, consolidation or sale or other disposition, beneficially own, directly or indirectly, more than 50% of, respectively, the then outstanding shares of common stock and the combined voting power of the then outstanding voting securities entitled to vote generally in the election of directors, as the case may be, of the corporation resulting from such reorganization, merger, consolidation or sale or other disposition, or (B) an approval by the shareholders of Pitney Bowes Inc. of a complete liquidation or dissolution of Pitney Bowes Inc. or of the sale or other disposition of all or substantially all of the assets of Pitney Bowes Inc. |
Section 8.Amendment or Termination of Plan.
The Company reserves the right to amend, modify or terminate this Plan at any time by action of its Board, provided that such action shall not adversely affect any Eligible Director’s rights under the provisions of this Plan with respect to awards which were made prior to such action.
Section 9.Administration of Plan.
This Plan shall be administered by the Governance Committee of the Board or any successor committee having responsibility for the remuneration of the directors (hereinafter referred to as the “Administrator”). All decisions which are made by the Administrator with respect to interpretation of the terms of the Plan, or with respect to any questions or disputes arising under this Plan, shall be final and binding on the Company and on the Eligible Directors and their heirs or beneficiaries.
Section 10.Recapitalization.
In the event of any change in the number or kind of outstanding shares of Common Stock of the Company by reason of a recapitalization, merger, consolidation, dividend, combination of shares or any other change in the corporate structure or shares of stock of the Company, the Board will make equitable and appropriate adjustments in the number of shares to be awarded to each Eligible Director under Section 4, in the number of shares subject to and any other affected provisions of outstanding awards of restricted stock units to prevent enlargement or diminution of the benefits intended to be granted under the Plan.
[This Page Intentionally Left Blank]

DIRECTIONS:
Northbound on I-95
Please take Exit 7 (Greenwich Avenue) and proceed through the first intersection to next traffic light, where you should turn right onto Washington Boulevard. Continue straight on Washington Boulevard. (Washington Boulevard becomes Dyke Lane.) At the end of Dyke Lane, turn left onto Elmcroft Road. Please park where indicated.
Southbound on I-95
Please take Exit 7 (Atlantic Street) and stay in the middle lane. Turn left onto Washington Boulevard. Continue straight on Washington Boulevard. (Washington Boulevard becomes Dyke Lane.) At the end of Dyke Lane, turn left onto Elmcroft Road. Please park where indicated.
From the Merritt Parkway
Please take Exit 34 (Long Ridge Road). Turn south onto Long Ridge Road. Follow Long Ridge Road for approximately 2 miles to Cold Spring Road and turn right onto Cold Spring Road. Bear left onto Washington Boulevard and follow to the end (approximately 2 miles under railroad and I-95). (Washington Boulevard becomes Dyke Lane.) At the end of Dyke Lane, turn left onto Elmcroft Road. Please park where indicated.

This proxy statement is printed entirely on recycled and recyclable paper. | AD11997 |
 
PITNEY BOWES INC. 1 ELMCROFT ROAD
3001 SUMMER STREET
STAMFORD, CT 06926-070006926
VOTE BY INTERNET -www.proxyvote.com Use the Internet to transmit your voting instructions and for electronic delivery of information up until 11:59 p.m. Eastern Time the day before the cut-off date or meeting date. Have your proxy card in hand when you access the web site and follow the instructions to obtain your records and to create an electronic voting instruction form. ELECTRONIC DELIVERY OF FUTURE PROXY MATERIALS If you would like to reduce the costs incurred by our company in mailing proxy materials, you can consent to receiving all future proxy statements, proxy cards and annual reports electronically via e-mail or the Internet. To sign up for electronic delivery, please follow the instructions above to vote using the Internet and, when prompted, indicate that you agree to receive or access proxy materials electronically in future years. VOTE BY PHONE - 1-800-690-6903 Use any touch-tone telephone to transmit your voting instructions up until 11:59 p.m. Eastern Time the day before the cut-off date or meeting date. Have your proxy card in hand when you call and then follow the instructions. VOTE BY MAIL Mark, sign and date your proxy card and return it in the postage-paid envelope we have provided or return it to Vote Processing, c/o Broadridge, 51 Mercedes Way, Edgewood, NY 11717.
TO VOTE, MARK BLOCKS BELOW IN BLUE OR BLACK INK AS FOLLOWS: TO VOTE, MARK BLOCKS BELOW IN BLUE OR BLACK INK AS FOLLOWS: | | | | | M71210-P46056 | M86862-P61236 | KEEP THIS PORTION FOR YOUR RECORDS | THIS PROXY CARD IS VALID ONLY WHEN SIGNED AND DATED. | | DETACH AND RETURN THIS PORTION ONLY | | |
THIS PROXY CARD IS VALID ONLY WHEN SIGNED AND DATED. PITNEY BOWES INC.
| The Board of Directors recommends you vote FOR
all of the directors listed below.PITNEY BOWES INC. | | | | | | | | | | | | | | | | | | | 1. | Election of Directors | | | | | | | | | | | | | | | | | | | | Nominees: | | For | | Against | | Abstain | | | | | | | | | | | | | | | | | | | | | | | | | | | | | | | | | | | 1a. | Linda G. Alvarado | | £ | | £ | | £ | | | | | | | | | | | | | | | | | | | | | | | The Board of Directors recommends you vote FOR
proposals 2, 3 and 4. | | For | | Against | | Abstain | | | 1b. | Anne M. Busquet | | £ | | £ | | £ | | | | | | | | | | | | | | | | | | | | | | | | | | | | 1c. | Roger Fradin | | £ | | £ | | £ | | 2. RatificationThe Board of Directors recommends you vote FOR
each of the Audit Committee’s Appointment of the Independent Accountants for 2014.
3. Advisory Vote to Approve Executive Compensation.
4. Approval of the Pitney Bowes Directors’ Stock Plan.
| | £ | | £ | | £ | | nominees listed in proposal 1. | | | | | | | | | | | | | | | | | | | | | 1d. | Anne Sutherland Fuchs | | £ | | £ | | £ | | | | | | | | | | | | | | | | | | | | | | £ | | £ | | £ | | | 1e. | S. Douglas Hutcheson | | £ | | £ | | £ | | | | | | | | | | | | | | | | | | | | | | £ | | £ | | £ | | | 1f. | Marc B. Lautenbach | | £ | | £ | | £ | | | | | | | | | | | | | | | | | | | | | | | | | | | | | | | 1g. | Eduardo R. Menascé | | £ | | £ | | £ | | | | | | | | | | | | | | | | | | | | | | | | | | | | | | | | | 1h. | Michael I. Roth | | £ | | £ | | £ | | | | | | | | | | | | | | | | | | | | | | | | | | | | | | | | | | | | 1. | 1i. | David L. ShedlarzElection of Directors | | £For | Against | £ | | £ | | | Abstain | | | | | | | | | | | | | | | | | | | | | | | | | | | | | | | | | 1j. | David B. Snow, Jr.Nominees: | | £ | | £ | | £ | | | | | | | | | | | | | | | | | | | | | | | | | | | | | | | 1a. | Linda G. Alvarado | | o | o | o | | | | | | | | | | | | | | | | | | | | | | | | 1b. | Anne M. Busquet | | o | o | o | | The Board of Directors recommends you vote | For | Against | Abstain | | | | | | | | | | | FOR proposals 2 and 3. | | | | | | | | | | | | | | | | | | | | | | | 1c. | Roger Fradin | | o | o | o | | 2. | Ratification of the Audit Committee’s Appointment of the | o | o | o | | | | | | | | | | | | Independent Accountants for 2015. | | | | | | | | | | | | | | | | | | | | | | | 1d. | Anne Sutherland Fuchs | | o | o | o | | 3. | Advisory Vote to Approve Executive Compensation. | | o | o | o | | | | | | | | | | | | | | | | | | | | 1e. | S. Douglas Hutcheson | | o | o | o | | | | | | | | | | | | | | | | | | | | | | | | | | | 1f. | Marc B. Lautenbach | | o | o | o | | | | | | | | | | | | | | | | | | | | | | | | | | | 1g. | Eduardo R. Menascé | | o | o | o | | | | | | | | | | | | | | | | | | | | | | | | | | | 1h. | Michael I. Roth | | o | o | o | | | | | | | | | | | | | | | | | | | | | | | | | | | 1i. | David L. Shedlarz | | o | o | o | | | | | | | | | | | | | | | | | | | | | | | | | | | 1j. | David B. Snow, Jr. | | o | o | o | | | | | | | | | | | | | | | | | | | | | | | | | | | Please indicate if you plan to attend this meeting. | | £o | o | | £ | | | | | | | | | | | | | | | | | | | | | | | | | | Yes | | No | | | | | | | | | | | | | | | | | | | | | | | | | | | | | | | | | | | Please sign exactly as your name(s) appear(s) hereon. When signing as attorney, executor, administrator, or other fiduciary, please give full title as such. Joint owners should each sign personally. All holders must sign. If a corporation or partnership, please sign in full corporate or partnership name by authorized officer. |
| | | | | | | | | | | | | | | Signature [PLEASE SIGN WITHIN BOX] | Date | | Signature (Joint Owners) | Date | |
20142015 Annual Meeting of
Pitney Bowes Stockholders
May 12,
201411, 2015 9:00 a.m. Local Time Pitney
Bowes World HeadquartersHyatt Regency Hotel
1 Elmcroft Road, Stamford,1800 East Putnam Avenue, Old Greenwich, CT 06926-070006870
Upon arrival, please present this admission ticket and valid, government-issued
or acceptable photo identification at
the registration desk. Important Notice Regarding the Availability of Proxy Materials for the Annual Meeting:Meeting of Stockholders
to Be Held on May 11, 2015: The Notice and Proxy Statement and Annual Report to Stockholders, including the Report on Form 10-K
are available atwww.proxyvote.com.www.proxyvote.com. M71211-P46056M86863-P61236
Proxy Solicited on Behalf of Pitney Bowes Board of Directors
Annual Meeting of Stockholders May 12, 201411, 2015 Marc B. Lautenbach, Michael I. Roth,Monahan, Amy C. Corn, or any of them, with full power of substitution are hereby appointed proxies of the undersigned to vote all shares of common stock and $2.12 convertible preference stock of Pitney Bowes Inc. owned by the undersigned at the annual meeting of stockholders to be held in Stamford,Old Greenwich, Connecticut, on May 12, 2014,11, 2015, including any continuation of the meeting caused by any adjournment, or any postponement of the meeting, upon such business as may properly come before the meeting, including items as specified on the reverse side. The undersigned, if a participant in any of the Pitney Bowes 401(k) Plans (the “Plans”) for which T. Rowe Price Trust Company acts as directed Trustee (“Trustee”), hereby directs the trusteeTrustee to vote as indicated on the reverse side all Pitney Bowes common stock allocated to his or her account, as indicated on the reverse side, at the annual meeting of stockholders to be held in Stamford,Old Greenwich, Connecticut, on May 12, 2014.11, 2015. Shown on this card are all shares of common stock and $2.12 convertible preference stock registered in your name, held for your benefit in the dividend reinvestment plan and/or held for your benefit in the Plans. The shares represented hereby will be voted in accordance with the directions given by the stockholder.If a properly signed proxy is returnedwithout choices marked, the shares represented by this proxy registered in your name and/or held for your benefit in the dividend reinvestment plan will be voted FOR Items 1 through 4 (unless otherwise directed).3. If no proxy card is received or a properly signed proxy card properly executed is returned without choices marked, the plan shares represented by the proxy card will be voted with respect to Items 1 through 43 in the same proportion indicated by the properly executed voting instructions given by participants in the PlansPlan (unless otherwise directed by the employer). In their discretion, the proxies are authorized to vote in accordance with their judgment on such other business as may properly come before the meeting, including any continuation of the meeting caused by any adjournment, or any postponement of the meeting. Please mark, date, sign, and promptly return this proxy in the enclosed envelope, which requires no postage if mailed in the U.S., or grant your proxy via telephone or Internet as described on the reverse side. Continued and to be signed on reverse side
|